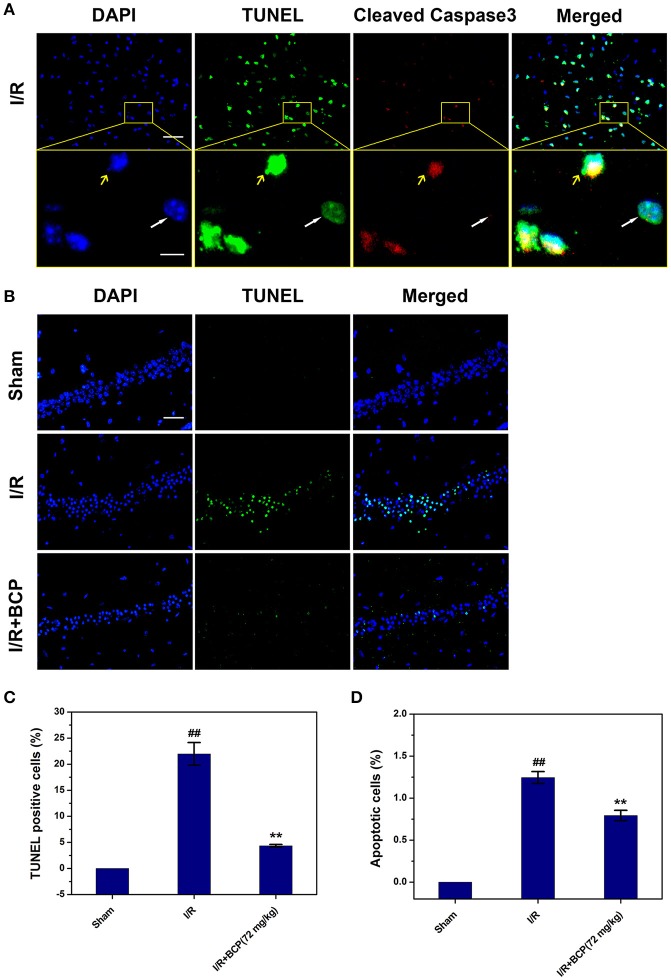
Figure 4.
BCP inhibits a component of necrotic cell death induced by I/R. (A) Representative microphotographs of TUNEL and cleaved caspase-3-positive cells in the cerebral cortex 48 h after MCAO. Scale bar 100 μm. Areas outlined in yellow are enlarged in lower panels. White arrows show necroptotic cells, and yellow arrows show apoptotic cells. Scale bar 20 μm. (B) Representative images of TUNEL-positive cells in the hippocampal CA1 region after I/R in mice treated with or without BCP (72 mg/kg). Scale bar 100 μm. (C,D) Percentage of apoptosis (cells with TUNEL and cleaved caspase-3 double positivity) and necrosis (cells with TUNEL-positive showing no cleaved caspase-3 activation) in the mouse brain in response to I/R treatment. Data are presented as the mean ± SEM (n = 3). ##p < 0.01 vs. sham, and **p < 0.01 vs. I/R.

