
FIGURE 2.
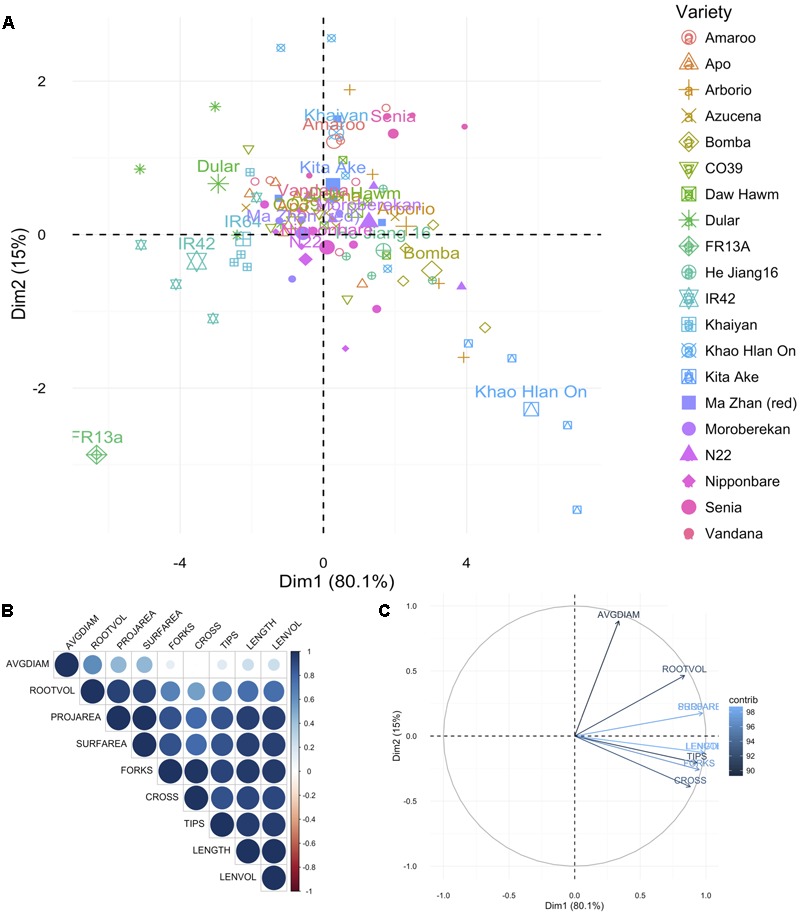
Principal component analysis for root traits. (A) Principal components (PC) of the 20 genotypes (individuals; listed in Supplementary Table 1) for the nine root traits, where each point represents individual genotype (four replications per genotype) and the 20 larger points represent the mean for each genotype. (B) Correlation matrix between the traits. Positive correlations are displayed in blue, and negative in red. Color intensity and circle size are proportional to the correlation coefficients as detailed in the legend. (C) PC plot of the nine root traits (variables) for the 20 genotypes, colored according to their percentage contribution to the component (variable cos2∗100/component cos2). Color and length of the arrow are proportional to the contribution to the component. Trait legend: AVGDIAM, average root diameter; ROOTVOL, root volume; PROJAREA, root projected area; SURFAREA, root surface area; FORKS, number of forks; CROSS, number of crosses; TIPS, number of tips; LENGTH, root length; LENVOL, ratio of root length to volume.