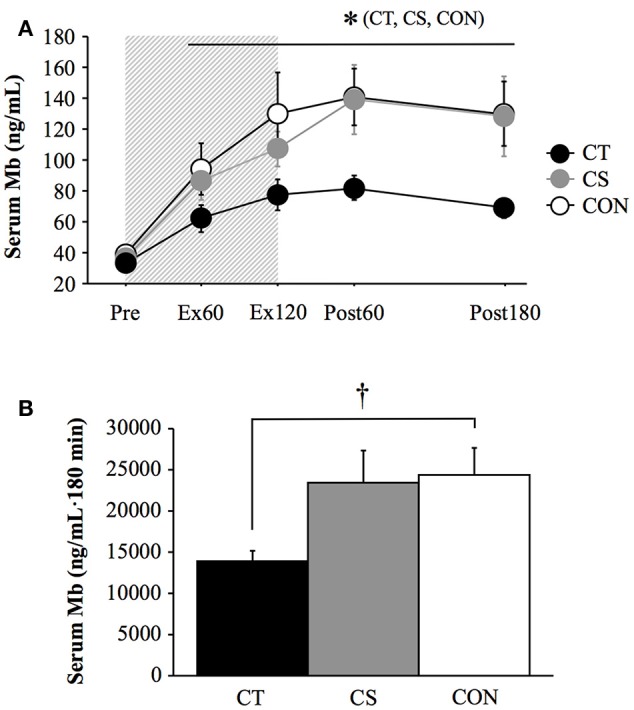
Figure 3.

Serum myoglobin (Mb) concentrations (A) and area under the curve for Mb during 180 min of post-exercise period (B). Values are mean ± standard error. The gray bar indicates a duration of 120 min uphill running. *P < 0.05 vs. Pre. †P < 0.05 between CT and CON. CT, compression garment on the thigh; CON, lower-body garment on the thigh and calf; Ex60, 60 min during exercise; Ex120, immediately after exercise. Post60, Post180, 60 min and 180 min after exercise.
