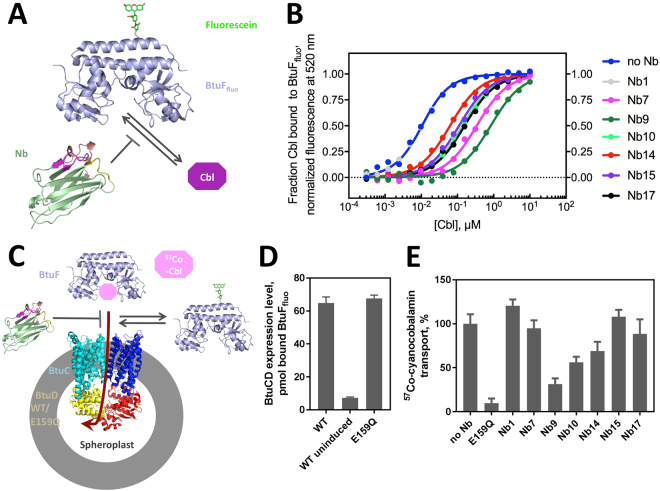
Figure 2.
Effect of nanobodies on BtuCD-F function. (A) Schematic of the substrate-binding assay. Fluorescently labeled BtuF (BtuFfluo) was used to measure cyanocobalamin (Cbl) binding in the presence of nanobody. (B) Equilibrium Cbl binding to BtuFfluo. Shown is the normalized fluorescence signal against substrate concentration (the raw fluorescence data is shown in Supplementary Figure 1). 5 nM BtuFfluo, Cbl concentrations ranging from 0.3 nM to 10 μM, and different Nb concentrations were used (5 μM for Nb1 and Nb14; 1 μM for Nb7, Nb15 and Nb17; 100 nM for Nb9 and Nb10). Affinity values for nanobody-BtuF binding were determined by numerical evaluation of the competitive binding data and shown in Table 1. Note that Nb1 is a control nanobody that does not bind BtuF. C) Schematic of the spheroplast-based substrate transport and BtuFfluo binding assays.57Co-cyanocobalamin (57Co-Cbl) transport into spheroplasts overexpressing WT BtuCD was measured in the presence of Nbs. (D) The BtuCD expression level in the spheroplasts was determined by the amount of BtuFfluo associated with the spheroplasts. Cells transformed with a plasmid containing WT BtuCD but without expression induction (‘WT uninduced’) served as a control. The fluorescence was detected using excitation at 485 nm and emission at 516 nm. (E) Cbl transport in the presence of Nbs. The following concentrations were used: 5 μM BtuF, 15 μM Cbl, 75 μM nanobodies and 0.08 g/ml spheroplasts (~0.45 μM BtuCD). A hydrolysis-deficient BtuD mutant, E159Q, was used as a negative control. Shown are mean and SEM of the transport rates determined by linear regression using 5 time points.

