Figure 4.
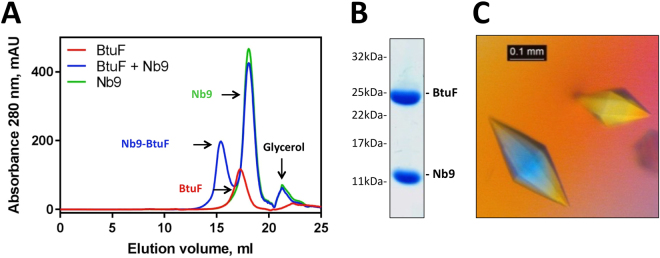
Purification and crystallization of Nb9-bound BtuF. (A) Size exclusion chromatography of the Nb9-BtuF complex. Note the shift of the elution peak of the Nb9-BtuF complex compared to the individual proteins. Equivalent amounts of protein (710 μg BtuF, 3.2 mg Nb9) were injected in all experiments. (B) SDS-PAGE analysis of isolated Nb9-BtuF complex after gel filtration confirmed the presence of both components. (C) Crystals of the Nb9-BtuF complex grown in optimized screens containing 100 mM Tris-HCl pH 8.5, 400 mM MgCl2 and 33% w/v PEG4000.

