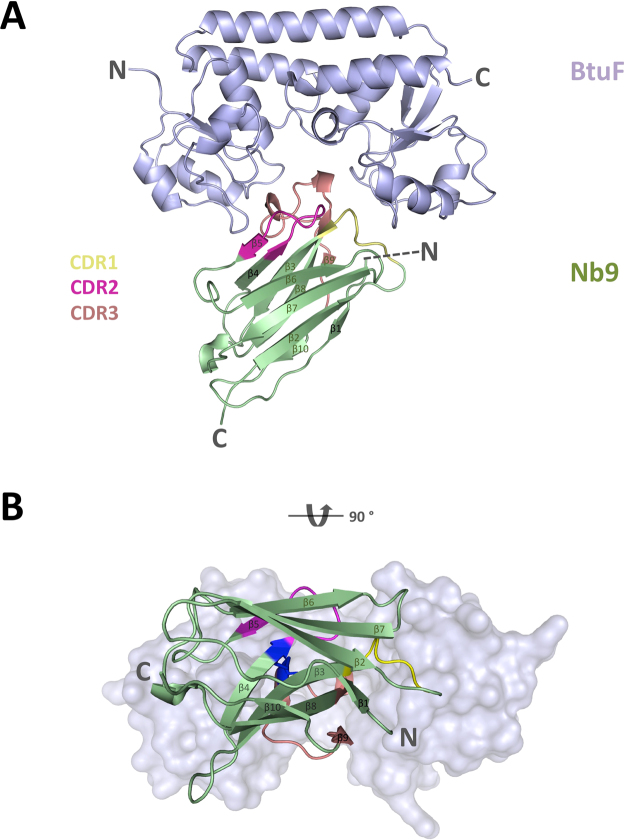
Figure 5.
Crystal structure of the Nb9-BtuF complex. (A) Ribbon diagram of BtuF in light blue, and Nb9 colored green with CDR1, CDR2 and CDR3 regions colored yellow, magenta and salmon, respectively. The amino- and carboxy-termini are indicated with N and C, respectively. (B) View onto the substrate-binding and Nb-binding site. Note the stabilizing disulfide bond in dark blue between the CDR2 (C72) and CDR3 (C128) loops. BtuF is displayed in light blue surface representation.

