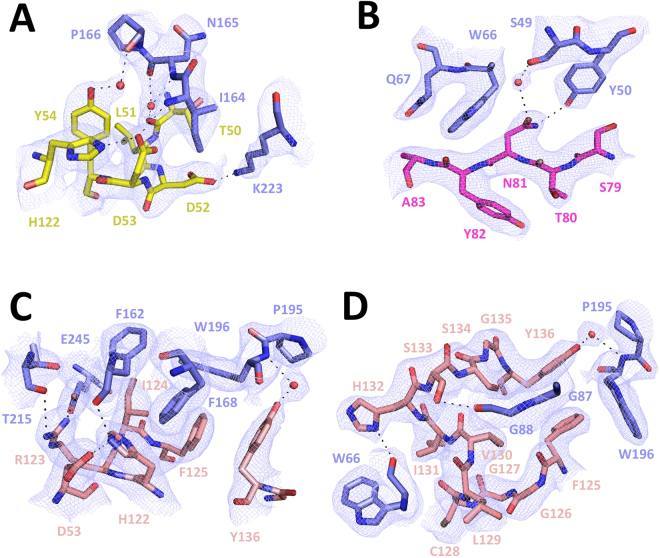
Figure 6.
Details of the Nb9-BtuF interface. Illustrated are the interactions of BtuF with CDR1 (A), CDR2 (B), CDR3 N-terminal part (C) and CDR3 C-terminal part (D). BtuF is shown in blue and the CDR regions are colored yellow (CDR1), magenta (CDR2) and salmon (CDR3). Oxygen and nitrogen are shown in red and blue. Water molecules are indicated with red spheres. Shown is the sigma A-weighed 2Fo-Fc electron density map contoured at 1σ.

