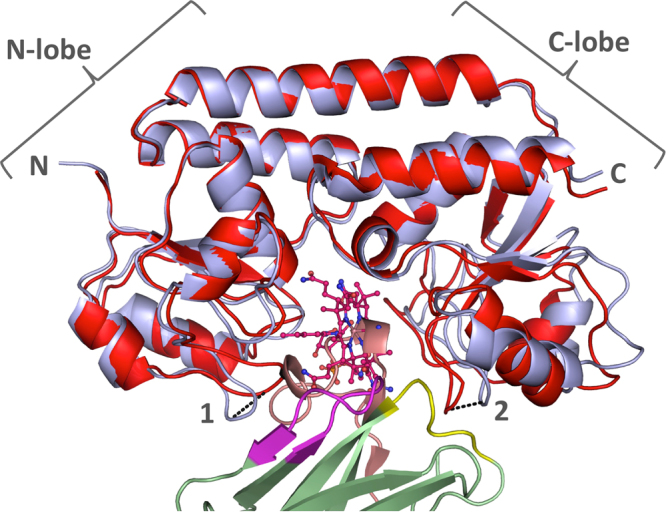
Figure 7.

Comparison of Nb9-BtuF complex with Cbl-bound BtuF. Nanobody-bound BtuF is shown in light blue cartoon representation, with the nanobody in green with colored CDRs (CDR1, yellow; CDR2, magenta; CDR3, salmon). Cbl-bound BtuF (PDB ID 1N4A) is displayed in red and Cbl is shown in stick representation with oxygen in red, nitrogen in blue, and cobalt in brown. The two BtuF chains superimposed with an RMSD of 1.53 Å over 243 atoms. Distances of Cα position between corresponding atoms in the loops gating the entrance of the substrate-binding pocket are indicated (1: 5.5 Å, Q67 in Nb9-BtuF and 2: 4.4 Å, N165 in Nb9-BtuF). The C-lobe of BtuF displays more pronounced structural changes than the N-lobe.
