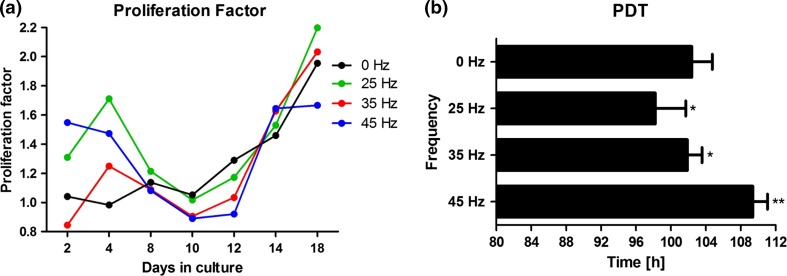
Figure 4.
Proliferation factor (a), population doubling time (b) during osteogenic differentiation. *p value < 0.05, **p value < 0.01, all groups vs. control culture. Proliferation factor calculated as arbitrary unit based on number of cells in comparison to control. Proliferation factor equal to 1, represents the same rate as the control. Values above 1 indicate on increase cells viability, whereas below 1 as decrease.

