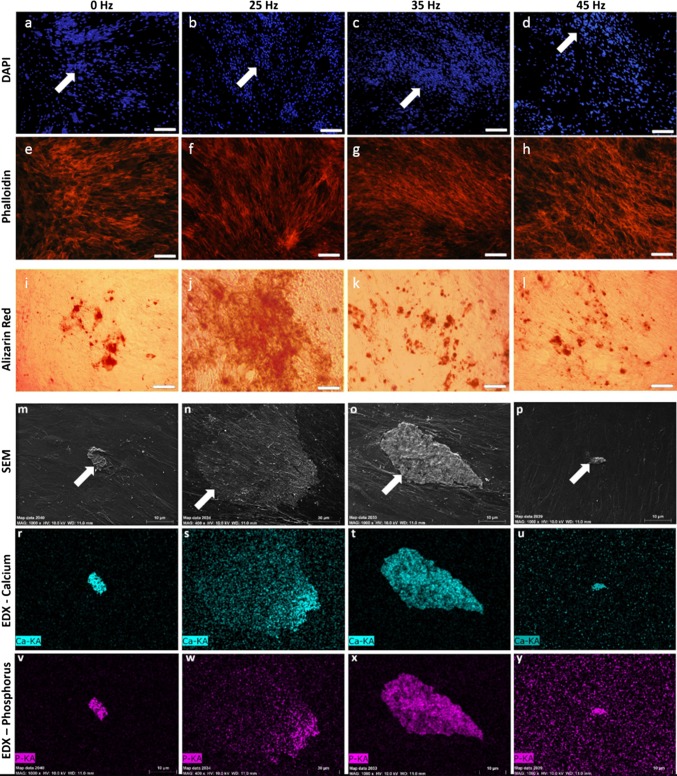
Figure 5.
DAPI (a–d) and Phalloidin (e–h) staining of osteocytes, Alizarin Red staining of calcium deposition (i–l) (magnification 50×, scale bar = 600 µm), SEM (m–p) and EDX images of hydroxyapatite-like structure formation (r–y). Significantly greater osteogenic nodule, and calcium and phosphorus deposits were observed in groups stimulated with 25 Hz vibration (magnification 1000×, scale bar = 10 µm, for 25 Hz: magnification 400×, scale bar = 30 µm). KA K alpha, name of the series of emission in the EDS spectra.

