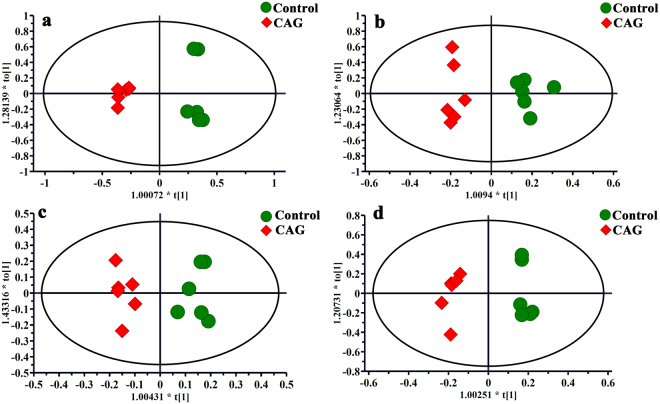
Figure 4.
OPLS-DA scores plots from the CAG rats and the controls in serum (a, R2X = 0.741, R2Y = 0.982, Q2 (cum) = 0.889), stomach (b, R2X = 0.552, R2Y = 0.943, Q2 (cum) = 0.487), medulla (c, R2X = 0.69, R2Y = 0.942, Q2 (cum) = 0.599) and cerebral cortex (d, R2X = 0.665, R2Y = 0.98, Q2 (cum) = 0.726) tissues. For all sample types, a good separation between the control group and CAG group was initially observed, indicating a noticeable change in metabolic profile occurred in CAG group.

