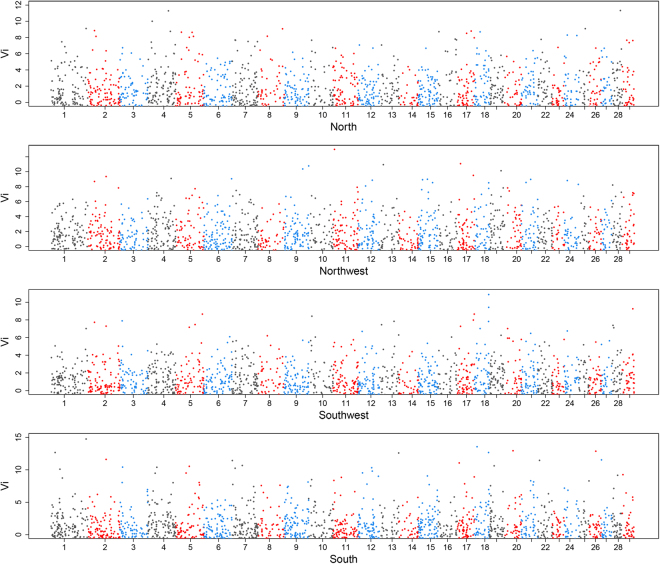
Figure 4.
Genome-wide distribution of V i values among North, Northwest, Southwest and South groups. The V i value was defined as a function of unbiased estimates of all pairwise V ST between one group and the remaining groups within a population, and V i statistic was suitable for detecting selection specific involved with CNVs to a particular group. The distribution of V i for each CNVR across all auto chromosomes is shown for each group. Alternating color indicates V i values from adjacent chromosomes.

