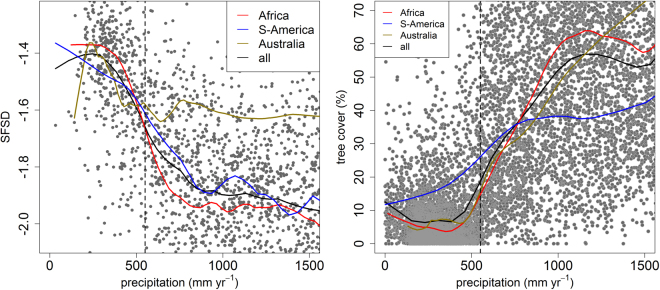
Figure 2.
The slope of the fire size distribution (SFSD) over precipitation for the global tropics with the running means plotted as solid lines and the 550 mm precipitation threshold indicated (a). Tree cover is plotted over precipitation (b), with the coinciding shift at 550 mm indicated. Tree cover is derived from LiDAR data19 using the percentage of LiDAR footprints with vegetation height >5 m as an indicator of tree cover at 0.5° resolution (see supplementary material).

