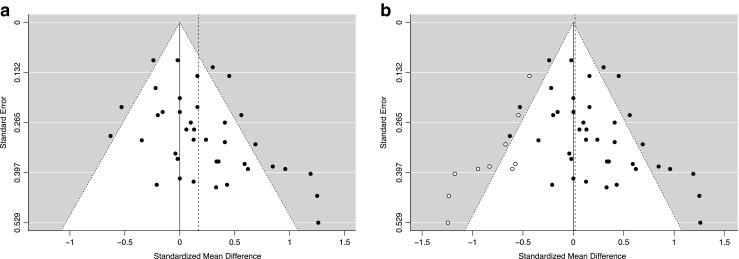
Fig. 16.

a Funnel plot showing the relationship between the effect sizes and standard errors of previous studies into the relationship between media multitasking and distractibility. Effect sizes are plotted along the x-axis and standard errors along the y-axis, and the gray areas denote the areas in which effects were statistically significant. The vertical dashed line indicates the estimated mean effect size. b Funnel plot including the effects that were imputed using the trim and fill method
