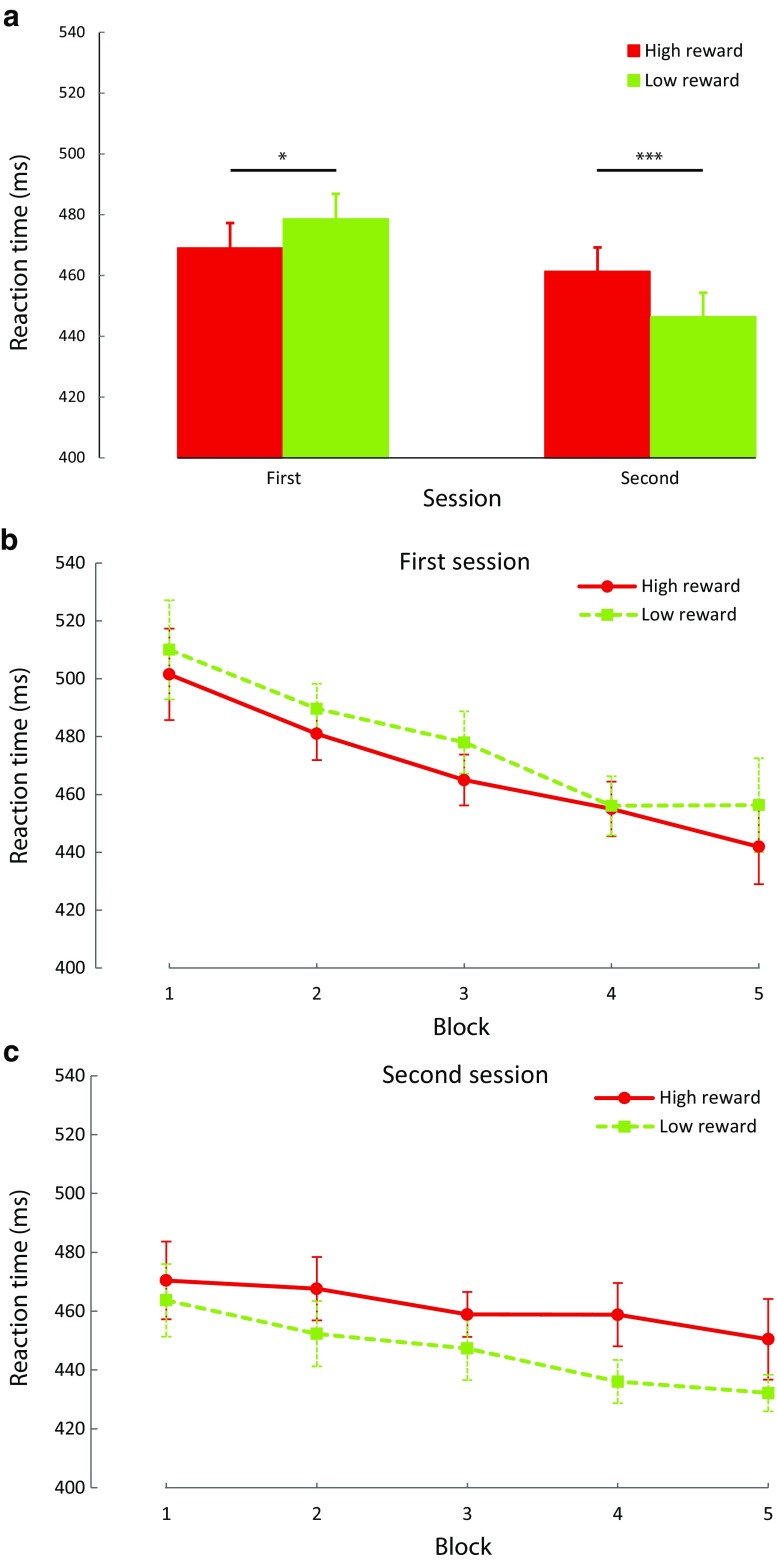
Fig. 2.
Results of Experiment 1. (a) Mean reaction time by reward condition over sessions. (b) Mean reaction time by reward condition over all blocks of the first session. (c) Mean reaction time by reward condition over all blocks of the second session. These graphs illustrate that the reward effect flipped from the first to the second session. In the first session, mean reaction time was significantly quicker for high- compared with low-reward trials. In the second session, the opposite pattern was observed with a significantly slower mean reaction time for high- compared with low-reward trials. Error bars represent within-subject 95% confidence intervals (Cousineau, 2005; Morey, 2008) and ***p < 0.001, **p < 0.01, *p < 0.05, † p < 0.10, n.s. p > 0.10 here and in all other figures

