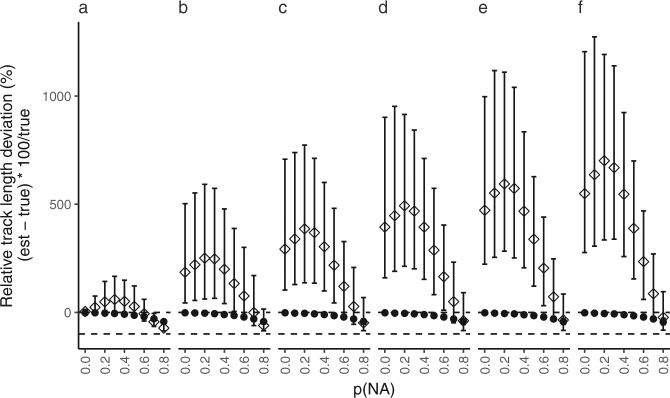
Figure 3.
Effect of probability of missing detections (p(NA)) on relative track length. Mean relative track length differences between true and estimated track (±5th and 95th percentile; TDOA (◊); YAPS (●)). Negative values indicate that estimated tracks are shorter than true and vice versa. Each panel show results from level of probability of multipath (p(MP)): (a) 0.00, (b) 0.01, (c) 0.02, (d) 0.03, (e) 0.04 and (f) 0.05. Horizontal lines (- - -) indicating 0% and −100% are given for reference.

