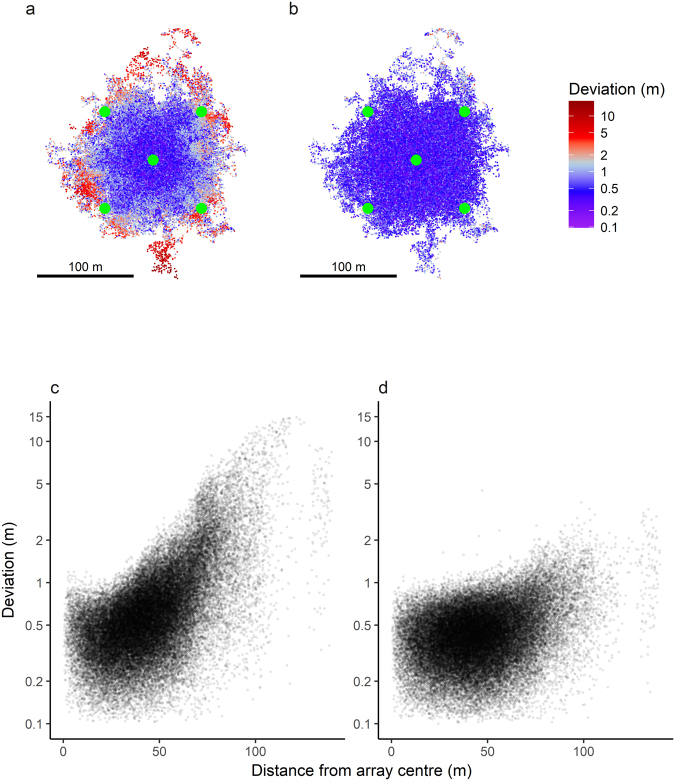
Figure 4.
Spatial component of estimation error. Overall, both models performed well inside the hydrophone array, but estimation accuracy deteriorated more in the TDOA model as distance to array centre increased. (a and b) True trajectories of all 200 simulated tracks. Colours represent distance from estimated to true position for model TDOA (a) and YAPS (b); notice that colour scale is non-linear. Root mean square distances to true position was 1.21 for model TDOA and 0.44 for YAPS. The simulated hydrophone array ( ) is indicated. (c and d) Distance from estimated to true position as a function of distance to array centre from model TDOA (c) and YAPS (d). Notice y-axis is log(y + 0.1)-transformed.

