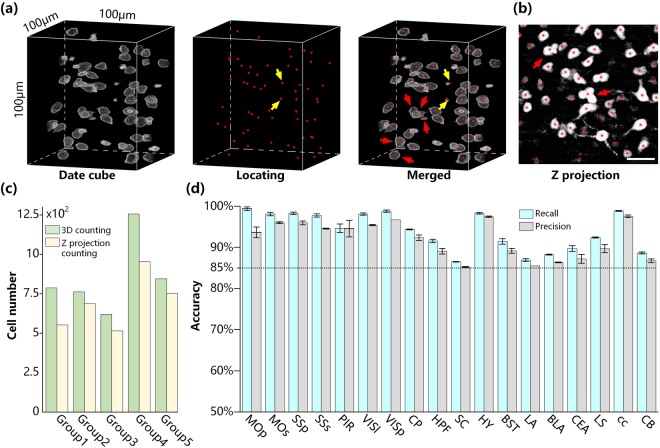
Figure 3.
Stereological cell counting accuracy using the NeuroGPS algorithm. (a) Automatically locating the neurons in an SC data cube from a SOM-IRES-Cre:Ai3-EYFP mouse brain dataset using NeuroGPS. Grey represents EYFP-labelled somas in the raw data, and red dots indicate identified soma centres using the NeuroGPS algorithm. Overlapping grey somas and red dots indicate the correct identification of neurons. Yellow arrows represent erroneous commission. (b) The 100 μm-thick Z-projection image of the data cube in (a). Red arrows represent some disjunctive cells in the z-direction in (a) that partially overlap in (b). (c) Comparison between stereological and planar cell counting in 3D data cubes and their own z-projection images, respectively. (d) Accuracy of automated stereological cell counting in the regions of SOM-IRES-Cre:Ai3-EYFP mice brains (n = 3). Abbreviations: MOs, Secondary motor area; LS, Lateral septal nucleus; BST, Bed nuclei of the stria terminalis; cc, Corpus callosum; PIR, Piriform area; SSp, Primary somatosensory area; SSs, Supplemental somatosensory area; BLA, Basolateral amygdala nucleus; LA, Lateral amygdala nucleus; VISp, Primary visual area; VISl, Lateral visual areas; HY, Hypothalamus; CEA, Central amygdala nucleus; SC, Superior colliculus; CB, Cerebellum.

