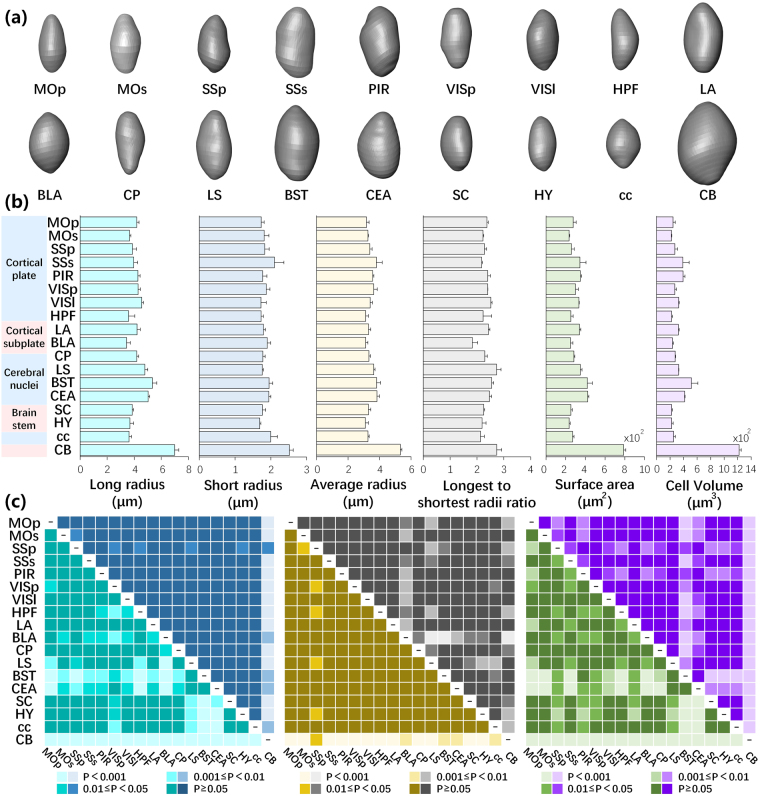
Figure 5.
Morphological features of SOM neuronal somas. (a) Morphological reconstructions of typical SOM neuronal somas in specific brain regions. (b) Morphological features of SOM neuronal somas in spe cific brain regions in a data cube of 100 × 100 × 100 μm (n = 3). Error bars represent SEM. (c) Statistical significance of morphological features of SOM neuronal somas between different regions. Corresponding to (b), cyan, blue, yellow, grey, green and purple represent the long, short and average radii, longest to shortest radii ratio, surface area and cell volume, respectively.

