
Fig. 9.
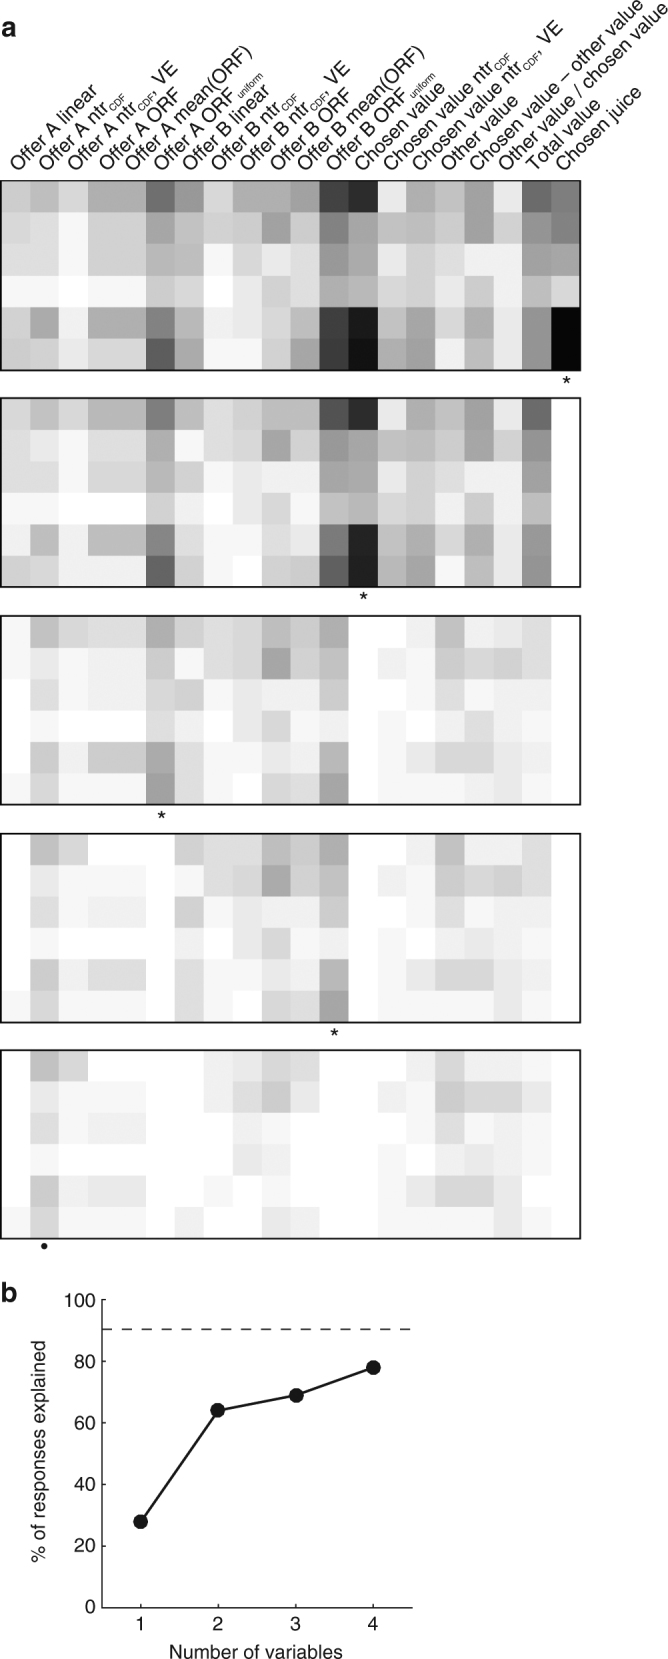
Variable selection analysis. a Stepwise selection. The top panel is as in Fig. 8b. At each iteration, the variable providing the maximum number of best fits in a time window was selected and indicated with a * in the figure. All the responses explained by the selected variable were removed from the pool and the procedure was repeated on the residual data set. Selected variables whose marginal explanatory power was <5% were eliminated (Methods) and indicated with a • in the figure. In the first four iterations, the procedure selected variables chosen juice, chosen value, offer A ORFuniform and offer B ORFuniform, and no other variables were selected in subsequent iterations. b Percent of explained responses. The y-axis represents the percentage of responses explained at the end of each iteration. The total number of task-related responses (1378) corresponds to 100%. The number of responses explained by at least one of the variables included in the analysis (1245/1378=90%) is indicated with a dotted line