Fig. 4.
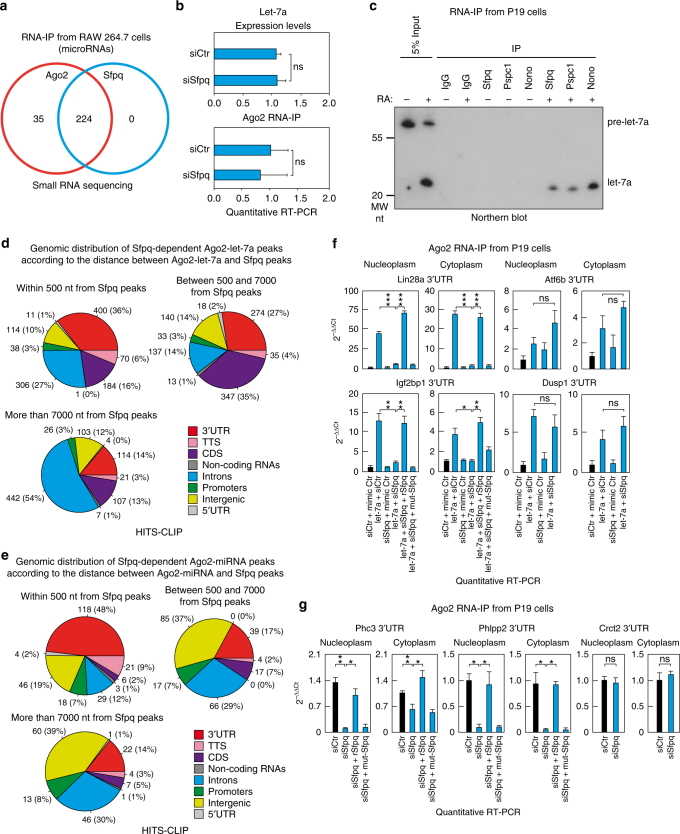
Sfpq promotes miRNA targeting at selected binding sites. a Venn diagram of Ago2 or Sfpq RNA-IP-enriched miRNAs found by small RNA sequencing analysis. b Let-7a expression levels (upper panel) and RNA-IP of Ago2 and let-7a (lower panel) in control or siSfpq-transfected RAW 264.7 cells. RNA extracts were analyzed by RT-qPCR. Data are presented as the mean ± s.e.m. (n = 6) and normalized to U2 snRNA or the input, respectively. c Sfpq, Pspc1, and NonO interact with mature let-7a in RA-treated P19 cells. Cell extracts were immunoprecipitated with the indicated antibodies and RNA was purified and analyzed by Northern blotting. Genomic distribution of either the d Ago2-let-7a or e endogenous Ago2-miRNA peaks decreased upon Sfpq knockdown, according to the distance to Sfpq peaks by HITS-CLIP analysis. These data show the prevalence of the Sfpq-dependent Ago2 peaks in the 3′UTR when Sfpq binds closely (<500 nt). RNA-IP of Ago2 and the indicated 3′UTRs for either f let-7a or g the endogenously expressed miR-302b-binding sites. P19 cells were transfected with the indicated molecules. Nucleoplasm and cytoplasm fractions were separated. The indicated cell lysates were incubated with either 100 nM full-length recombinant wild-type Sfpq or the Sfpq-214–598 quadruple mutant (L535A, L539A, L546A, and M549A) for 30 min at room temperature. Before IP, the lysate was partially digested with 10 μg ml−1 RNase A for 30 min at room temperature. RNA was purified from the immunocomplexes and from 5% of the input and analyzed by RT-qPCR using oligonucleotide probes surrounding the miRNA-binding sites identified by HITS-CLIP. Data are presented as the mean ± s.e.m. (n = 3) and normalized to their own inputs. Student’s t-test (for b) or one-way ANOVA followed by Tukey’s post hoc test (for f, g) with *p < 0.05 and **p < 0.01. ns not significant, TTS transcription termination site

