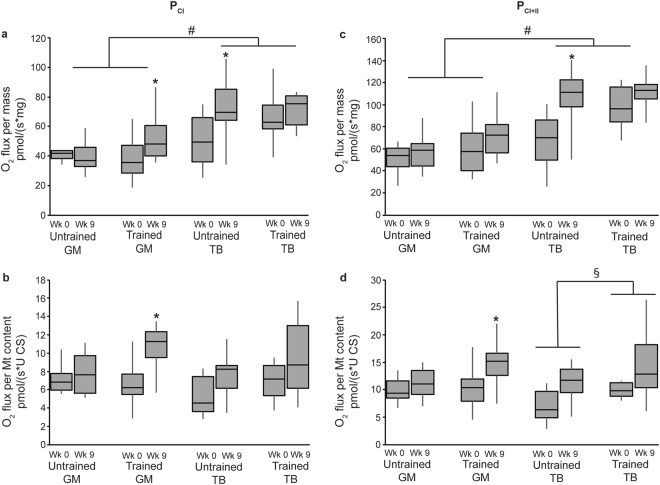
Figure 2.
Integrative (a,c) and intrinsic (b,d) mitochondrial ADP-stimulated respiration (P) in the gluteus medius (GM) and triceps brachii (TB) of horses before and after 9 wk of either receiving no forced exercise (Untrained; n = 6 GM, n = 6 TB) or being exercise trained (Trained; n = 17 GM, n = 6 TB). (a) P with complex I substrates (PCI), glutamate and malate, relative to tissue weight; (b) PCI relative to mitochondrial content; (c) PCI plus succinate, a complex II substrate (PCI+II), relative to tissue weight; and (d) PCI+II relative to mitochondrial content. Data were analyzed using a mixed model ANOVA with repeated measures. Boxplots represent the median (line in center of box) and the 1st and 3rd quartiles, and error bars represent the 95% confidence interval. Overall effects for panels a, b, c, and d, respectively, of time (P = 0.02, P = 0.004, P = 0.002, P = 0.002), muscle (P < 0.0001, P = 0.3, P < 0.0001, P = 0.5), training (P = 0.2, P = 0.02, P = 0.03, P = 0.005), time × muscle (P = 0.5, P = 0.9, P = 0.2, P = 0.4), time × training (P = 0.9, P = 0.2, P = 0.4, P = 0.4), muscle × training (P = 0.8, P = 0.7, P = 0.5, P = 0.5), and time × muscle × training (P = 0.05, P = 0.3, P = 0.2, P = 0.6). *Within training and muscle group, wk 0 different than wk 9 (P < 0.05). #Across untrained and trained, GM different than TB (P < 0.05). §Across GM and TB, untrained different than trained (P < 0.05).

