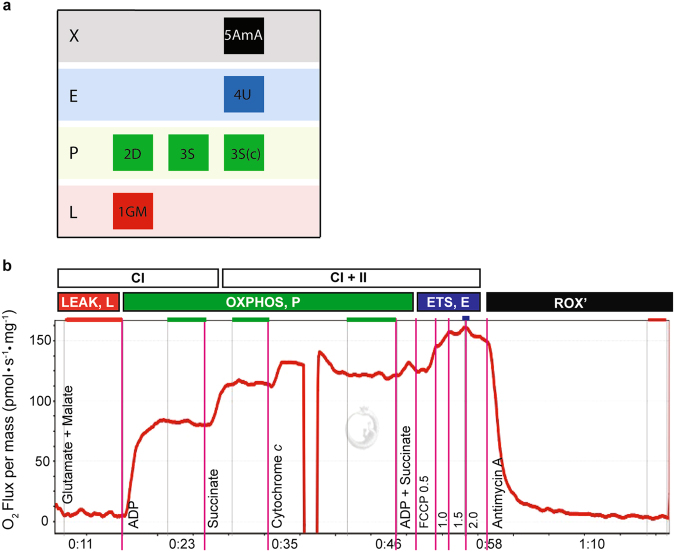
Figure 5.
Experiment design (a) and example output (b; DatLab software by Oroboros, Innsbruck, Austria) from a high-resolution respirometry experiment on the Oxygraph-2k. The y-axis shows O2 flux per mass (pmol ▪ s−1 ▪ mg−1), with time on the x-axis. The SUIT protocol for this study was as follows: glutamate + malate (10 mM and 2 mM; LEAK, state 2), ADP (2.5 mM; PCI), succinate (10 mM; PCI+II), cytochrome c (10 μM), ADP + succinate (2.5 mM and 10 mM), 0.5 μM titrations of FCCP (ECI+II), and antimycin A (2.5 μM; ROX). O2 concentration was maintained between 200 and 500 pmol/mL throughout the experiment.

