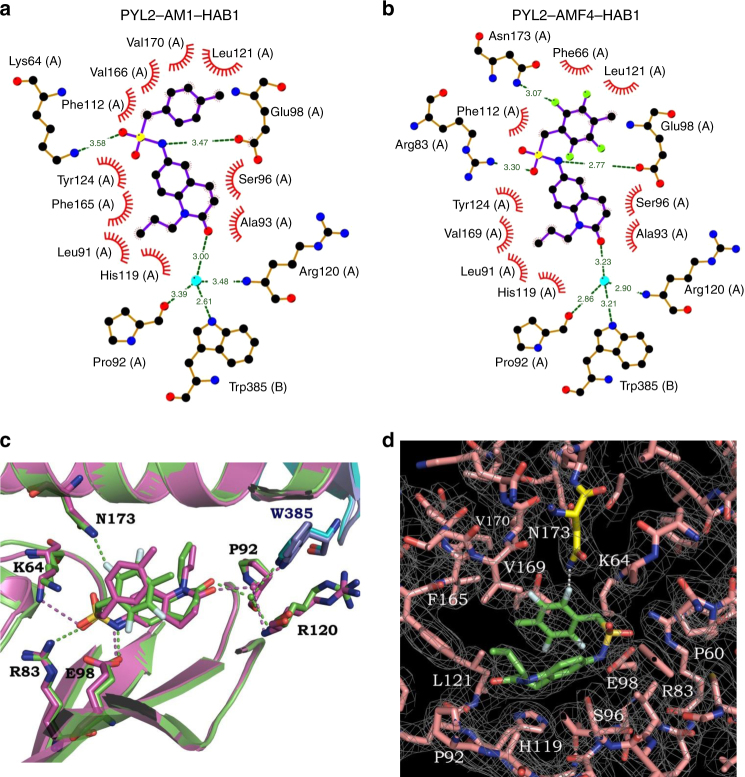
Fig. 3.
Structural comparison of AM1 and AMF4 within the PYL2–HAB1 complex. a, b Two-dimensional structural schematics of interactions between AM1 (a) or AMF4 (b) and residues in the PYL2 ligand-binding pocket (A) or in HAB1 (B). The schematics show an increase in the number of hydrogen bonds (dashed lines) between the fluorine atoms (green-filled circles) of AMF4 and the nitrogen atoms (blue-filled circles) of the Asn173 residue in the PYL2-binding pocket. Red-, yellow-, blue-, and turquoise-filled circles represent oxygen atoms, sulfur atoms, nitrogen atoms and water molecules, respectively. The number represents the distance (Å) between two atoms/molecules. The PYL2–AM1–HAB1 schematic model is from previously published paper23. c Overlay of three-dimensional structural schematics of AM1 (purple) with AMF4 (green) in the PYL2-binding pocket, with hydrogen bonds (dashed lines) and water molecules (filled circles) for AM1 and AMF4 in purple and green colors, respectively. d A 2F o–2F c electron density map of bound AMF4 and its surrounding residues contoured at 1.0σ. N173 of PYL2 is highlighted in yellow and the white dotted line represents the hydrogen bond between the fluorine atom of AMF4 and N173 of PYL2

