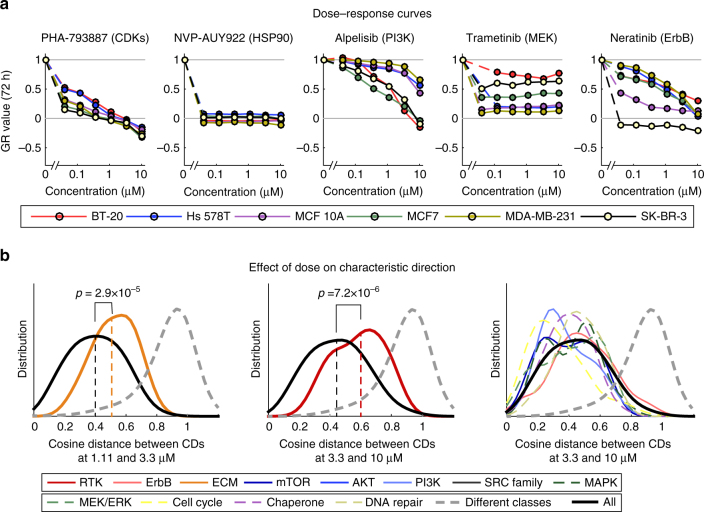
Fig. 2.
Variation of molecular and phenotypic responses by cell line and concentration. a Dose–response curves across six cell lines for a subset of drugs that exhibit significant responses at the level of L1000 signature and phenotype. A GR value of one represents growth at the same rate as the untreated control, a value of zero denotes a complete cytostatic response, and a negative value denotes a cytotoxic response. b Differences in characteristic directions with increase in drug dose as scored by the cosine distance between the characteristic directions of L1000 signatures. Data for ECM inhibitors between 1.11 and 3.33 µM are shown in yellow (left panel) and receptor tyrosine kinase inhibitors between 3.33 and 10 µM are shown in red (middle panel). For comparison, the data for all other inhibitor classes between 3.33 and 10 µM are shown (right panel). Each curve is a smooth density plot by class of drug target. Each distribution is based on an average of 44, but at least 20, different conditions that generally comprises all cell lines. The black line in all panels shows the distribution of all perturbations, colored lines show the distribution for each class of drug targets as indicated in the legend, and dashed gray line the distribution for angles between drugs of different classes

