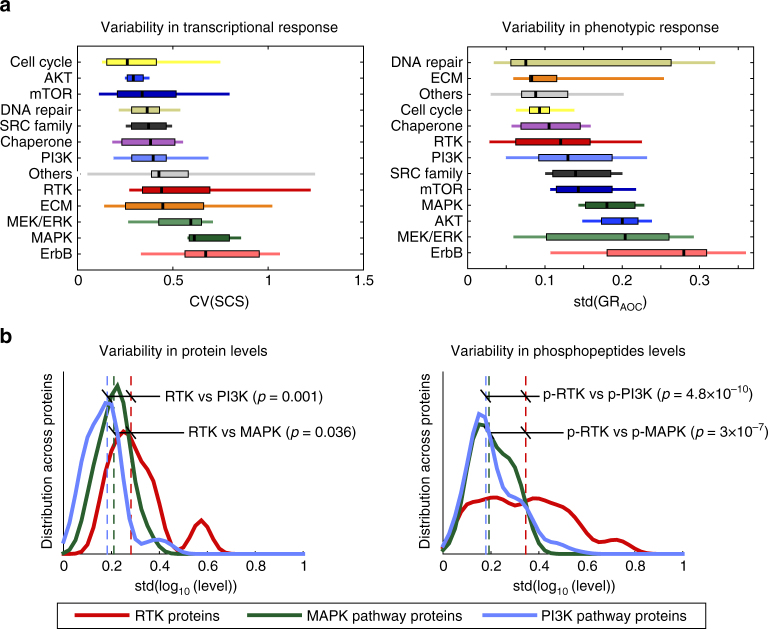
Fig. 3.
Variation in L1000 signature and phenotypic response with drug class. a Boxplots of the distributions of the coefficient of variation of the signature consistency score at 24 h, a measure of differences in L1000 signature at all tested doses, by drug target class sorted by the median across all six cell lines (left). Boxplots of the distribution of the standard deviation of the GRAOC (a measure of phenotypic response across all doses for a particular drug) by drug class sorted by the median across all six cell lines (right). Black lines represent the median, boxes the interquartile range, and upper and lower lines the 5 and 95% quantiles. b Distribution of standard variation of protein (left) and phospho-peptide (right) levels across six cell lines as measured by shotgun mass spectrometry for proteins in the MAPK and PI3K pathways and of RTKs. On each graph the significance of the difference in distribution between RTK and signaling pathways is indicated. The identities of proteins included in this analysis, as well as complete mass spectrometry profiles, are included in Supplementary Data 4

