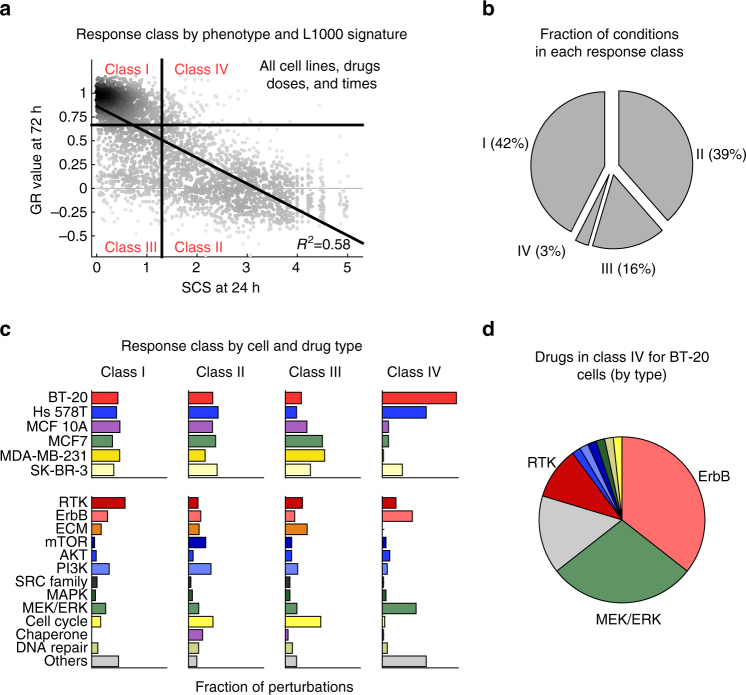
Fig. 4.
Transcriptional responses are generally correlated with phenotypic responses. a Scatterplot showing the phenotypic response (GR) and consistency of L1000 responses at 24h (SCS) for all drugs and all cell lines divided into four classes based on a cutoff of GR = 0.66 and SCS = 1.3. Class I: Non-responsive by both measures; Class II: responsive by both measures; Class III: responsive by GR, but not by L1000 SCS; Class IV: responsive based on L1000 SCS, but not by GR. b Fraction of perturbations in Class I–IV responses broken down by cell lines (left) and drug target classes (right). c Fraction of perturbations in response classes I–IV. d Breakdown of Class IV perturbations in BT-20 by drug target classes

