Fig. 6.
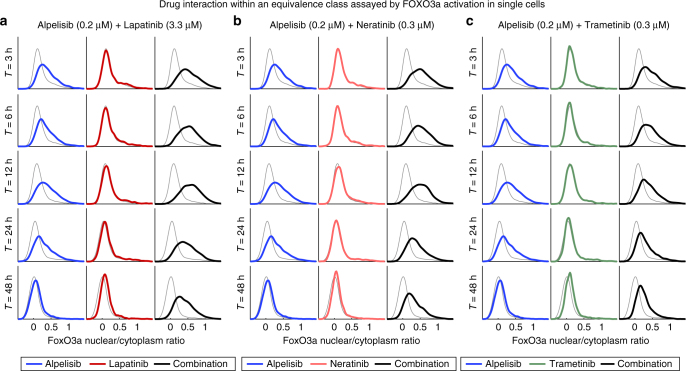
Class IV drugs suppress the recovery of FoxO3a signaling. a–c Distribution of the nuclear/cytoplasmic ratio FoxO3a as measured by quantitative immunofluorescence microscopy at timepoints indicated. For each distribution, ~2000 cells were analyzed. Cells were treated with alpelisib in combination with either a lapatinib, b neratinib, or c trametinib at the concentrations shown. Gray line show untreated control, blue alpelisib, red the EGFR or MEK inhibitor, and black the combination treatment. Data shown is one out of three biological replicates

