Figure 6.
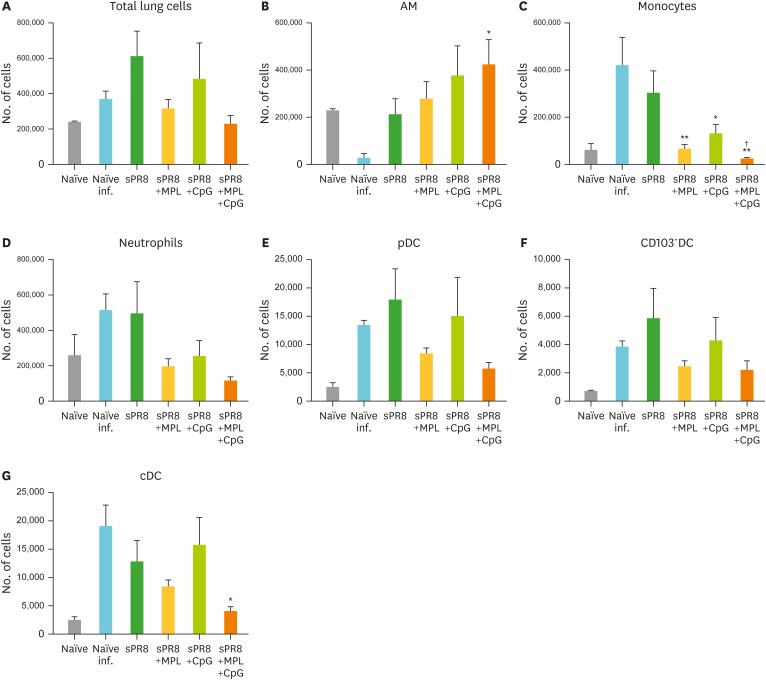
Cellular infiltration in lungs after lethal virus infection. The immunized mice (n=5) were infected with A/PR8 virus (2×LD50) after 6 weeks of immunization. Lung samples were harvested day 7 post infection, and cell phenotypes were determined by flow cytometry and calculated by multiplying cell percentages with total cell numbers. (A) Total lung cells. (B) AMs; CD11b−CD11c+F4/80+. (C) Monocytes; CD11b+F4/80+Ly6Chigh. (D) Neutrophils; CD11b+F4/80−Ly6c+. (E) pDCs; CD45+F4/80−CD11c+MHCIIhighB220+. (F) CD103 + DC; CD45+F4/80−CD11c+MHCIIhighCD11b−CD103+. (G) cDC; CD45+F4/80−CD11c+MHCIIhighCD11b+. All results were shown in mean±SEM. For statistical analysis, One-way ANOVA and Tukey's post-multiple comparison tests were performed.
pDC, plasmacytoid dendritic cell; cDC, conventional DC.
*p<0.033; **p<0.002 compared to naïve infection group; †p<0.033 compared to sPR8 group.

