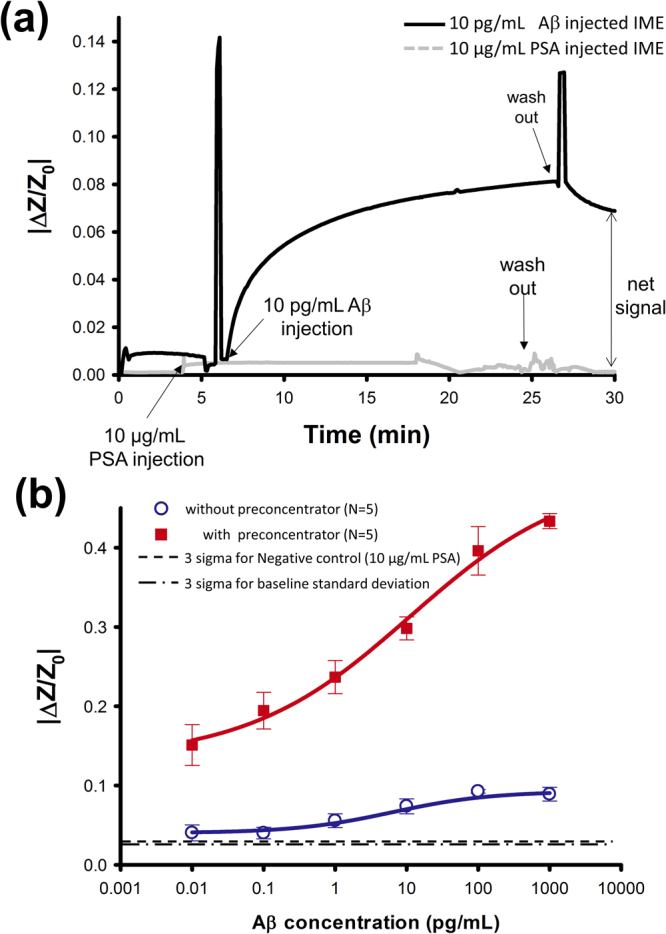
Figure 3.

System performance with respect to Aβ detection. (a) Real-time detection of 10 pg/mL Aβ and 10 μg/mL PSA. The net signal differential was calculated between the sample and control. (b) Electrical signal versus Aβ concentration using a preconcentration step (red; squared), showing great increase in sensitivity and LOD while no significant increase in slope without a preconcentration step (Blue; open dot). Three sigma based lines of standard deviation were calculated both from mean value of 0.1 pg/mL Aβ signal. Three sigma for negative control (10 μg/mL PSA) were calculated with the standard deviation.
