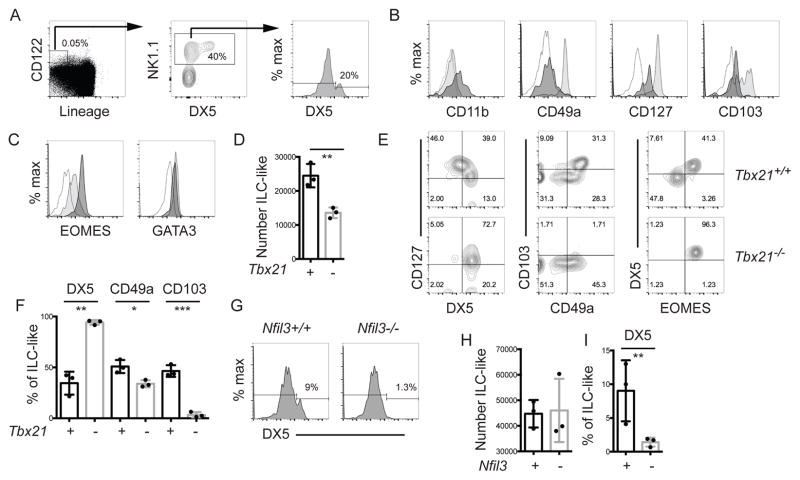
Figure 1. Characterization of the phenotype and transcription factor requirements of murine thymic ILC-like cells.
Wild-type C57BL/6 thymocytes were analyzed by FACS for (A) ILC-like cells (Lin−CD122+ NK1.1+). Lineage = TCRβ, TCRγ, CD3ε, CD4, and CD8. DX5 expression on ILC-like cells is also shown. (B) CD11b, CD49a, CD127 and CD103, and (C) EOMES and GATA3, expression on DX5+ (dark) and DX5− (light) ILC-like cells. The open profile is the FMO. (D) Mean number ± SEM of thymic ILC-like cells in Tbx21+/+ and Tbx21−/− mice ± SEM. (E) FACS analysis for CD127 versus DX5, CD103 versus CD49a, and DX5 versus EOMES on thymic ILC-like cells in Tbx21+/+ and Tbx21−/− mice. (F) Mean percent ± SEM of Tbx21+/+ (+, black) and Tbx21−/− (-, grey) thymic ILC-like cells expressing DX5, CD49a and CD103. (G) DX5 expression on thymic ILC-like cells from Nfil3+/+ and Nfil3−/− mice. (H) Thymic ILC-like numbers and (I) the percent DX5+ in Nfil3+/+ and Nfil3−/− mice. (A–C) Representative profile from > 7 experiments, (E, G) from 3 experiments with one mouse of each genotype/experiment. (D, F, H) Each dot represents one mouse. Unpaired t-test * p<0.05, **p<0.01, ***p<0.001.

