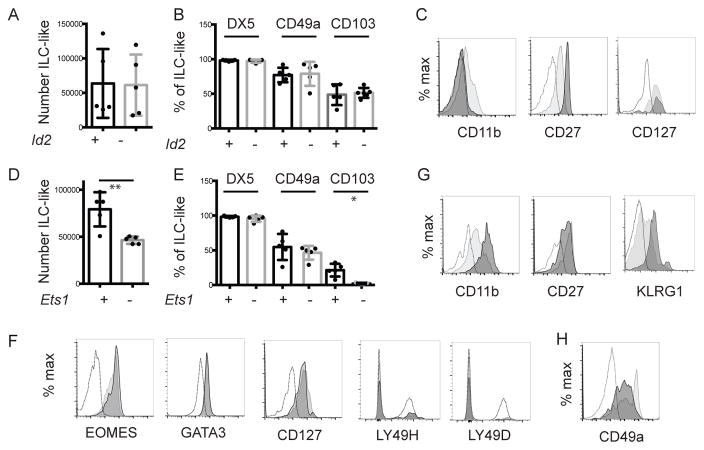
Figure 3. ID2 and ETS1 regulate the phenotype of tNK-cells.
Thymocytes from the indicated mouse strains were analyzed by flow cytometry. (A) Mean number ± SEM of thymic ILC-like cells in Rag1−/−Id2+/+ and Rag1−/−Id2−/− mice. (B) Mean percent ± SEM of Rag1−/−Id2+/+ (+, black) or Rag1−/−Id2−/− (-, grey) thymic ILC expressing DX5, CD49a or CD103. (C) FACS analysis for CD11b, CD27, and CD127 on Rag1−/−Id2+/+ (light grey) and Rag1−/−Id2−/− (dark grey) tNK cells. Open histogram is FMO. (D) Mean number ± SEM of thymic ILC-like cells in Rag1−/−Ets1+/+ and Rag1−/−Ets1−/− mice. (E) Mean percent ± SEM of Rag1−/−Ets1+/+ (+, black) or Rag1−/−Ets1−/− (-, grey) thymic ILC expressing DX5, CD49a or CD103. Flow cytometry analysis for (F) CD11b, CD27, and CD127, (G) EOMES and GATA3, (H) Ly49H and Ly49D, or (I) CD49a on Rag1−/−Ets1+/+ (light) and Rag1−/−Ets1−/− (dark) tNK cells. Open histogram in (F, G, I) is FMO, in (H) is splenic cNK. Data are representative of 3–7 experiments one mouse of each genotype. Each dot represents one mouse. Unpaired t-test * p<0.05, **p<0.01.

