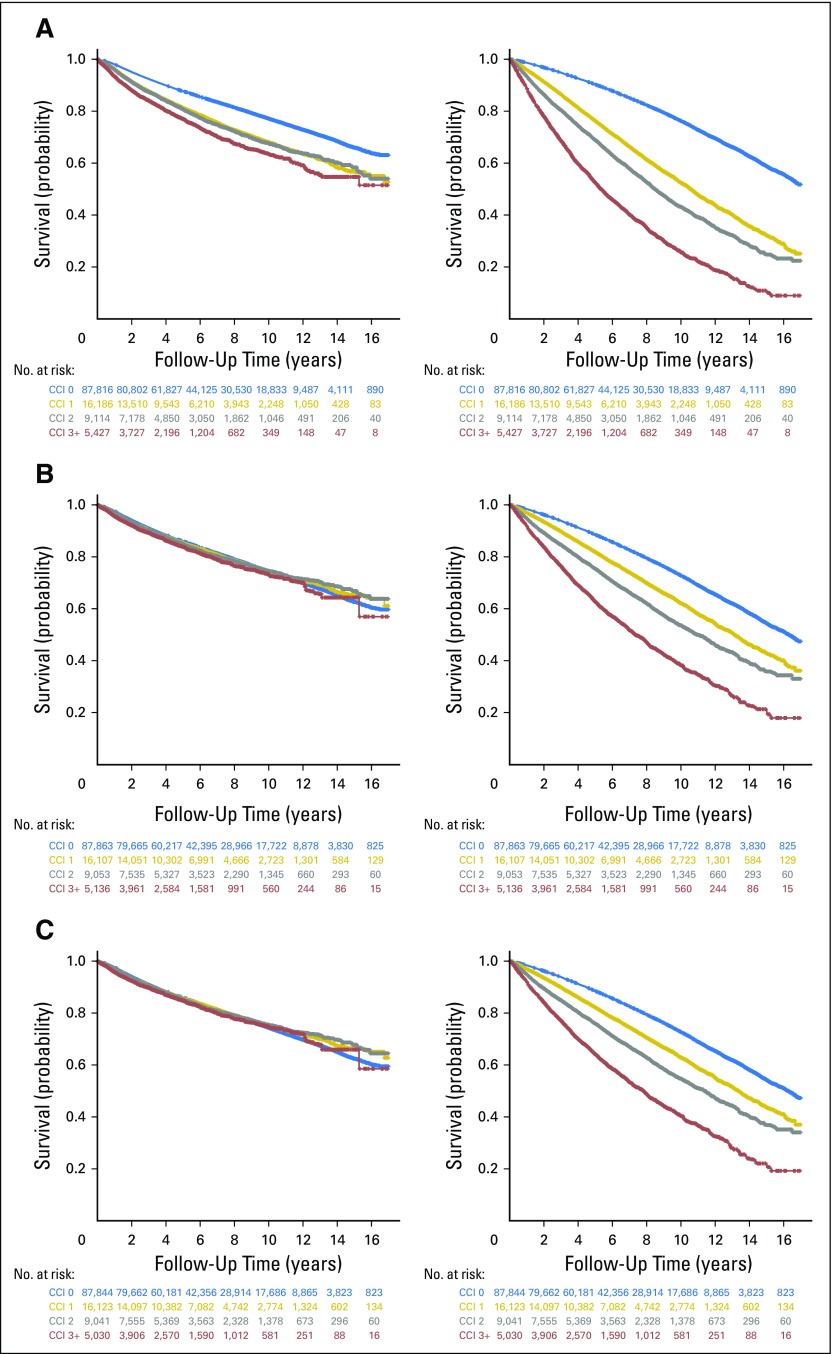
Fig 1.
Prostate cancer (PCa)–specific (left panels) and other-cause (right panels) survival for (A) a full cohort of patients without adjustments, (B) a full cohort of patients with adjustments for patient and tumor characteristics, and (C) a full cohort of patients with adjustments for patient and tumor characteristics, and treatment type. Unadjusted and adjusted Kaplan-Meier plots display cumulative survival probability and follow-up time . The number of patients at risk in each Charlson comorbidity index (CCI) group are tabulated at each time point on the x-axis with text colors corresponding to the same color for each curve on the Kaplan-Meier plot representing CCI 0 (blue), CCI 1 (gold), CCI 2 (gray), and CCI ≥ 3 (red).

