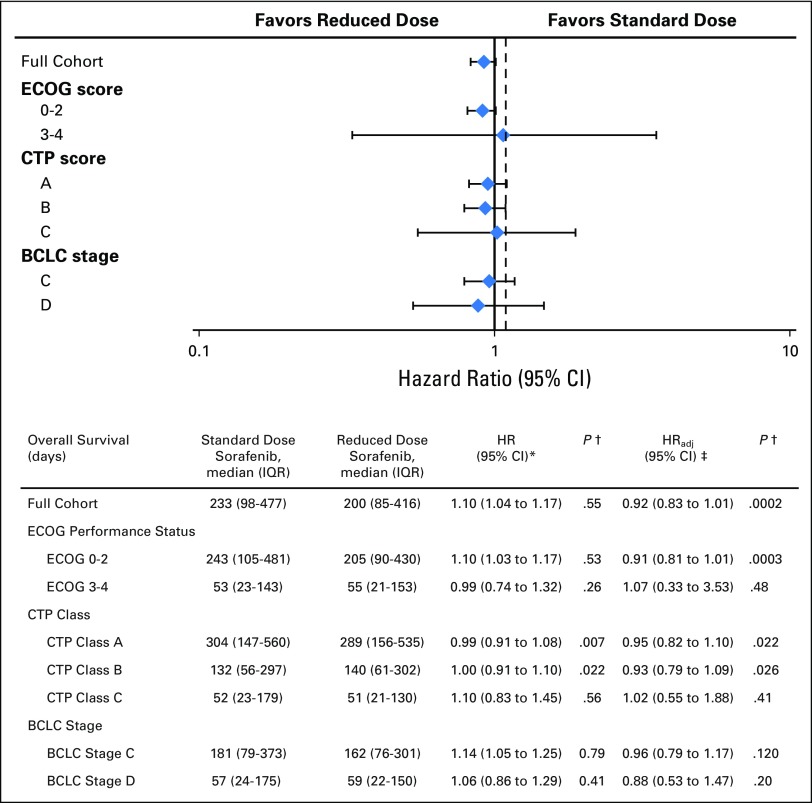
Fig 3.
Overall survival of selected subgroups. (*) Hazard ratio calculated prior to propensity score matching and without adjustment. (†) P values here indicate comparison against non-inferiority bound of HR 1.1 (Pni). Figure above based on the adjusted hazard ratio. Dashed reference line indicates non-inferiority boundary at HR = 1.1. (‡) Hazard ratio calculated after propensity score matching and after adjustment for Child-Turcotte-Pugh and Model for End-Stage Liver Disease Sodium scores in a multivariate model. BCLC, Barcelona Clinic Liver Cancer; CTP, Child-Turcotte-Pugh; ECOG, Eastern Cooperative Oncology Group; HR, hazard ratio.

