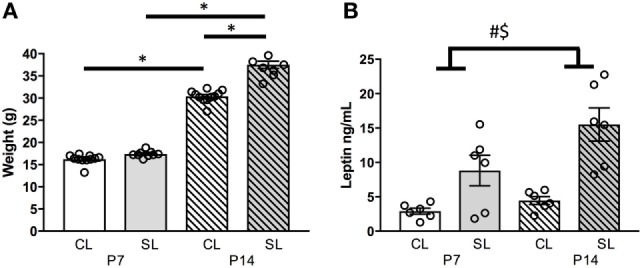
Figure 1.

Effects of neonatal overfeeding on the neonatal leptin system. (A) Body weights of control (CL) and small litter (SL) rats at postnatal day (P) 7 and 14, (B) plasma leptin concentrations at P7 and P14. Data are mean ± SEM. n = 6–10 per group. *Tukey’s post hoc. # significant main effect of litter size. $ significant main effect of age. p < 0.05. Note, in (A), error bars are overlapped by the data point circles.
