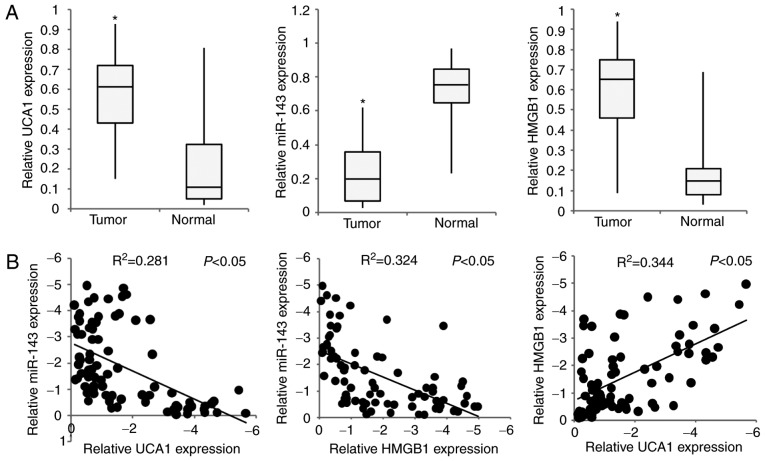
Figure 4.
Expression levels of miR-143, UCA1 and HMGB1 in bladder cancer tissues. (A) Relative expression of miR-143, UCA1 and HMGB1 in 52 bladder tumor tissues (tumor) and 29 adjacent noncancerous tissues (normal). (B) Spearman's correlation analysis was carried out between miR-143, UCA1 and HMGB1 expression in 81 samples (52 bladder tumor tissues and 29 adjacent noncancerous tissues). *P<0.05. UCA1, urothelial carcinoma associated 1; EMT, epithelial-mesenchymal transition; HMGB1, high mobility group box 1.

