
Figure 1. Differentially expressed miRNAs between highly internal lead-exposed and minimally internal lead-exposed workers in microarray. Fold change ≥2.0.
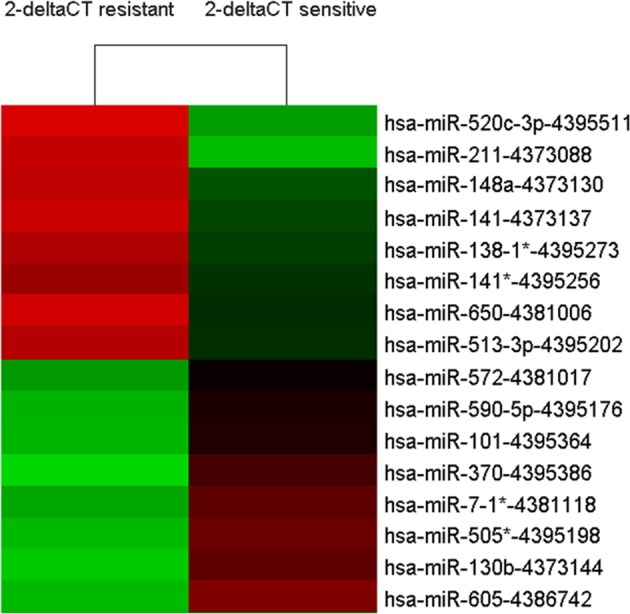
The red color indicates up-regulated miRNAs and the green color indicates down-regulated miRNAs. The symbol (*) represents the miRNA minor.