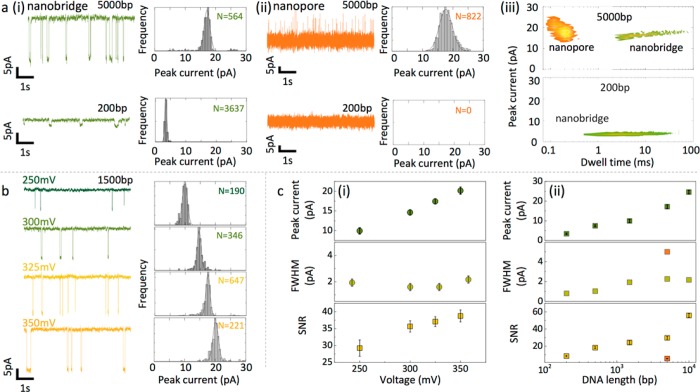
Figure 4.
dsDNA detection comparison between conventional and nanobridge configurations. (a) (i) Nanobridge configuration. Ionic current recordings for 5 kb DNA (top) and 200 bp DNA (bottom) recorded in 100 mM KCl at 250 mV voltage applied. Measurements and analysis were performed using a 10 kHz low-pass filter. For visualization purposes only, the trace was filtered at 200 Hz. The measured peak current was 17.17 ± 0.96 pA and 3.42 ± 0.34 pA respectively. (ii) Corresponding measurements in a conventional nanopore configuration. For 5 kbp the peak current was 17.65 ± 2.11 pA. No events were detected for 200 bp. (iii) Scatter plots showing the dwell time and peak current distribution for 5 kbp DNA (top) and 200 bp DNA (bottom) detected in the nanobridge and conventional configurations. (b) Voltage dependence on current blockade for 1.5 kbp DNA. The peak current as determined by Gaussian fitting was 9.94 ± 0.82 pA at 250 mV, 14.62 ± 0.68 pA at 300 mV, 17.43 ± 0.68 pA at 325 mV, and 20.16 ± 0.92 pA at 350 mV, respectively. (c) (i) Peak current, fwhm, and SNR dependence on voltage applied using the nanobridge configuration. The fwhm remained largely unchanged at 1.83 ± 0.28, while SNR increases from 29.2 ± 2.4 at 250 mV to 38.8 ± 1.8 at 350 mV due to decrease in DNA translocation time at higher voltages. (ii) Peak current, fwhm, and SNR dependence on DNA length at a fixed voltage (250 mV). In the nanobridge configuration the mean peak current scales with the radius of gyration squared of the DNA molecule: from 3.42 ± 0.34 pA for 200 bp to 24.59 ± 0.92 pA for 10 kbp. A similar trend was observed for the SNR, whereas the fwhm values remained similar. As point of reference SNR and fwhm for 5 kbp detected using a conventional configuration are plotted in the graph (orange square).

