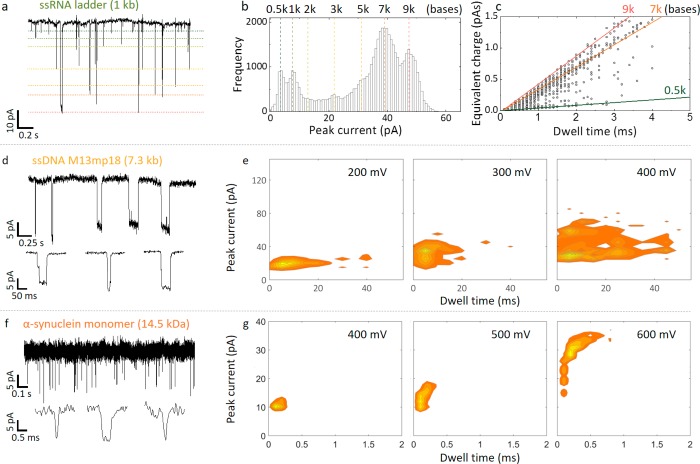
Figure 6.
Detection of ssRNA, ssDNA, and α-synuclein in the nanobridge configuration. (a) Current–time trace for a 1 kb ssRNA ladder (2 μg/mL) in 100 mM KCl at an applied bias of 400 mV. For visualization purposes, approximate levels are designated for each fragment size (0.5, 1, 2, 3, 5, 7, 9 kb). (b) Peak current histogram and (c) corresponding equivalent charge plot. (d) Current time trace for a 100 pM sample of M13mp18 ssDNA in 100 mM KCl at an applied bias of 200 mV. (e) Current–dwell time contour plots are shown for voltages of 200 mV, 300 mV, and 400 mV, respectively. Similar to dsDNA, the dwell times increase with voltage due to compacting of the DNA in the nanobridge. Events as slow as 40 ms could be detected which is substantially slower than in a conventional nanopore configuration. (f) Current–time trace for monomeric α-synuclein for a concentration of 700 pM in 100 mM KCl and recorded at an applied bias of 400 mV. (g) Current–dwell time contour plots are shown for voltages of 400 mV, 500 mV, and 600 mV, respectively.

