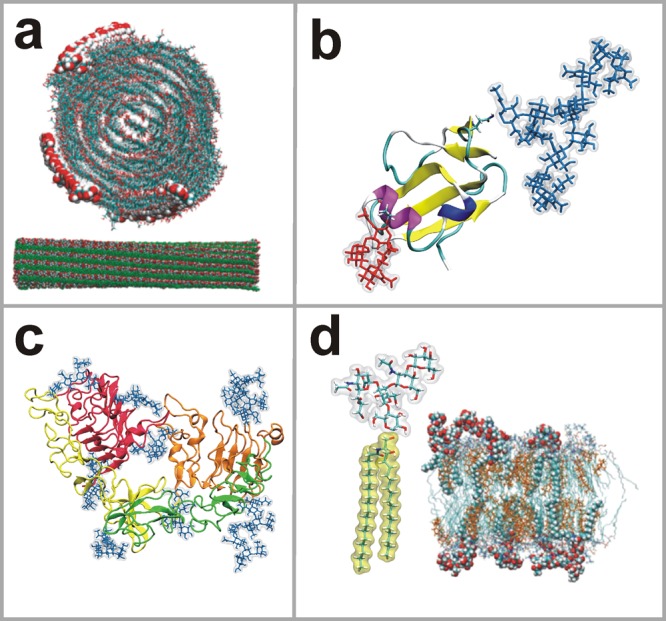
Figure 1.

Snapshots of simulations of different carbohydrate systems that have been built with the present tool set, used as examples in this article. (a) Crystalline cellulose fragment (Reprinted with permission from ref (25). Copyright 2011 American Chemical Society.); (b) CD59 protein showing N- and O-glycan branches rendered as blue and red licorice, respectively;26 (c) EGFR monomer showing N-linked glycans rendered as blue licorice;27 and (d) structure of the GM1 glycolipid together with a snapshot of a lipid bilayer with 5 mol % of GM1 (Reprinted with permission from ref (28). Copyright 2011 Nature Publishing Group).
