FIGURE 1.
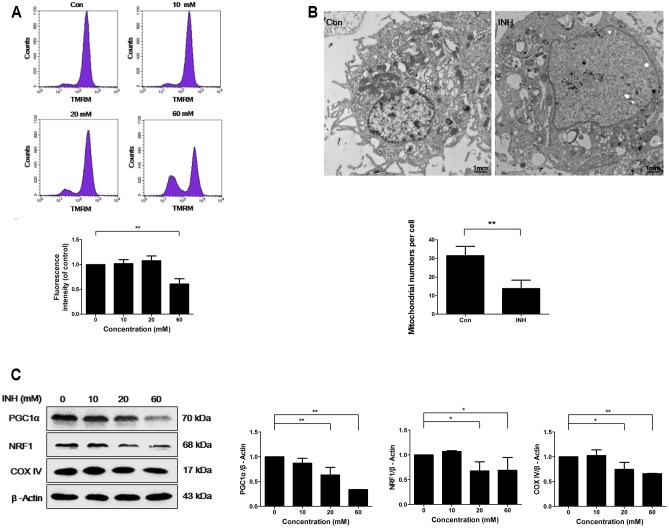
INH inhibited mitochondrial biogenesis. (A) HepG2 cells were exposed to the indicated concentrations of INH for 24 h, stained with TMRM, then harvested for measurement of mitochondrial membrane potential (MMP) by flow cytometry. The lower parts of (A), geometric mean (Geo Mean) was used to calculate the intensity of fluorescence. (B) Transmission electron microscopy was performed on HepG2 cells to examine the alteration in mitochondrial mass. Ten micrographic fields were randomly selected in each group. (C) Detection of protein expressions of PGC1α, NRF1 and COX IV by western blotting after treatment with different concentrations of INH for 24 h. Right parts of (C), PGC1α, NRF1 and COX IV quantitated by densitometry and plotted after normalization to β-actin. Results are the representatives of at least three independent experiments, respectively. Data are presented as mean ± SD of at least three independent experiments. ∗P < 0.05, ∗∗P < 0.01.

