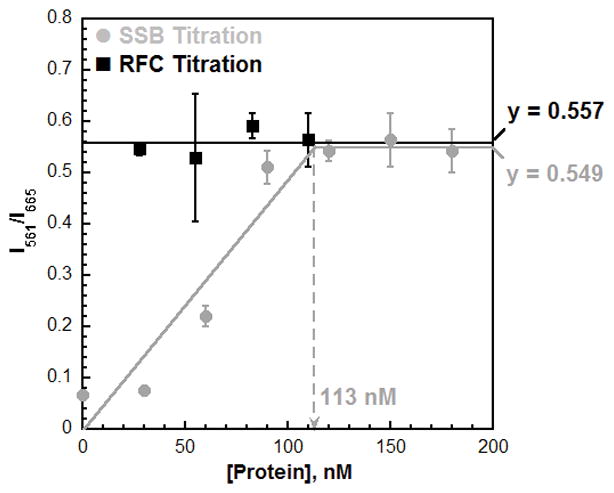
Figure 4.

Titrations of the steady-state FRET. The Cy3P/BioT70 DNA substrate (100 nM with 400 nM Neutravidin), ATP (1 mM), and Cy5-PCNA were held constant (110 nM homotrimer) and either saturated with RFC (110 nM) and titrated with SSB (0 – 180 nM) (
 ) or saturated with SSB (180 nM) and titrated with RFC (30 – 110 nM) (·). Results are plotted versus the concentration of the respective titrant. When SSB was titrated, the FRET signal increased linearly with SSB concentration up to 90 nM. Data points within this concentration range (0 – 90 nM SSB) were fit to a linear equation. After 90 nM, the FRET plateaus and remains constant with SSB concentration. Data points within this concentration range (120 – 180 nM) were fit to a flat line. The two lines intersect at the “breakpoint” where the Cy3P/BioT70 DNA substrate is saturated with Cy5-PCNA. When RFC was titrated, the FRET signal remained constant at a level (0.557) equivalent to that observed at saturating concentrations of RFC and SSB (0.549). These FRET values are identical to those observed for RPA (Table S1). This suggests that Cy5-PCNA encircling a P/T junction is in the same FRET state when the adjacent ssDNA is bound by either RPA or SSB.
