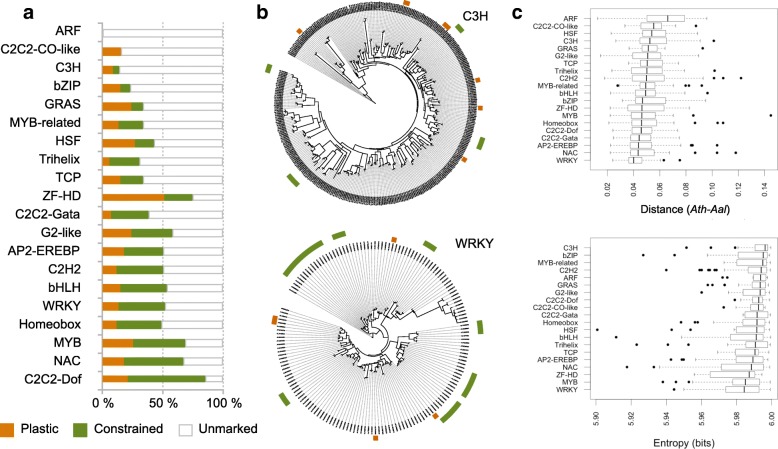
Fig. 4.
Plastic and constrained H3K27me3 marking among families of gene orthologs encoding transcription factors. a For each of the 20 largest gene families encoding transcription factors (TFs), the percentage of gene orthologs either not marked by H3K27me3 or else showing plastic or constrained H3K27me3 marking. b Phylogenetic trees showing the distribution of plastic or constrained H3K27me3 marking for the C3H and WRKY TF gene families. Color code is as in a. c Promoter sequence similarity (Ath-Aal comparisons, top panel) and tissue specificity of expression, as estimated by Shannon entropy for the 20 largest TF gene families (bottom panel)

