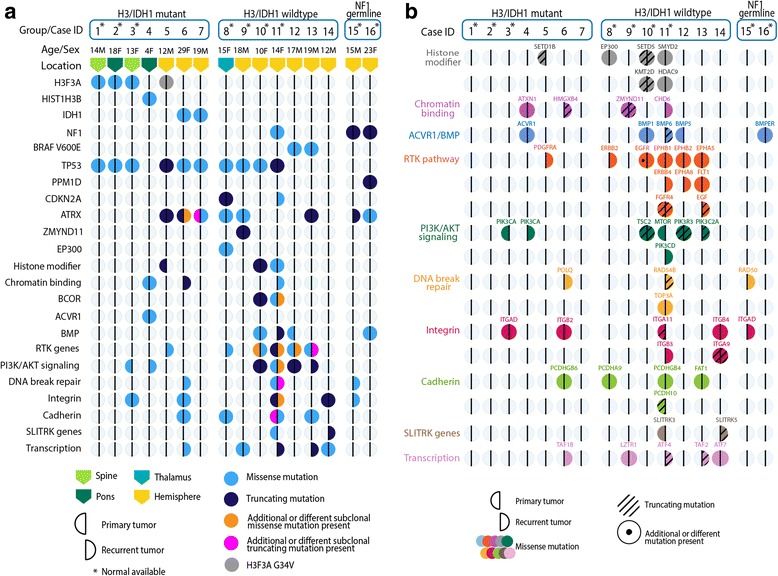
Fig. 1.

Mutational profile of primary and recurrence tumor pairs from 16 pediatric High-Grade Glioma (pHGG) patient samples analyzed in this study. Vertical columns of circles represent a tumor pair from an individual patient. The left half of a circle represents the primary tumor and the right half represents the recurrence. A fully colored circle indicates that both primary and recurrence tumors harbor the same mutation, and a half-colored circle indicates a mutation specific to the primary or recurrence. Horizontal rows show individual genes or gene groups/pathways that are mutated. Mutations shown are known to be pathogenic, found in COSMIC or TCGA, or have a high/medium functional impact. a Molecular group, age, sex and tumor location are indicated for each patient. Mutations are represented by colors: light blue = missense, dark blue = truncating (frameshift or nonsense), orange = additional/different missense, pink = additional or different truncating. b An expansion of each gene group showing individual genes mutated in each patient. Different gene groups are represented by different colors, truncating mutations are shown with a slanted line, and an individual dot represents an additional or different mutation is present
