
Fig. 4.
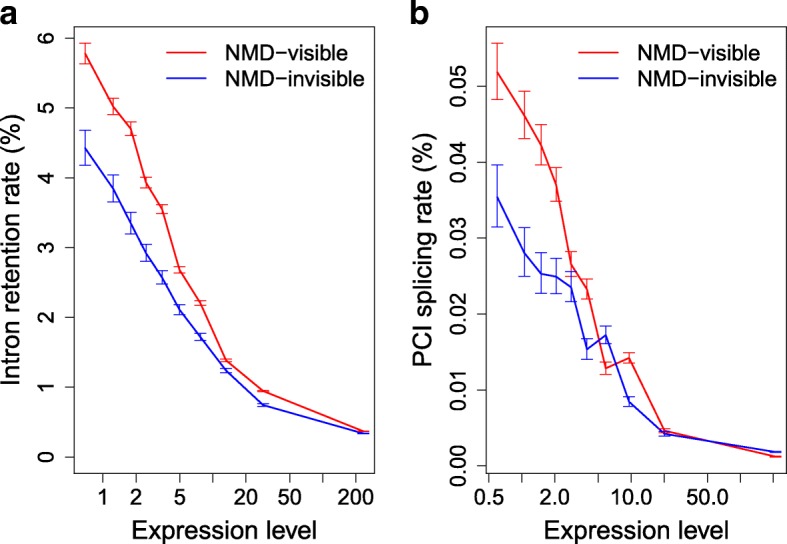
Relationship between AS rate and expression level, for NMD-visible or NMD-invisible AS events. a Introns were first classified into two groups according to their NMD-visibility in case of retention events (n = 52,163 NMD-visible introns, in red, and n = 12,996 NMD-invisible introns, in blue), and then further grouped into ten bins of equal sample size, according to gene expression levels in WT cells. IR rates (in WT cells) were measured globally in each bin. Error bars represent the 95% CI of the proportion of AS reads. b Same as (a), but for the splicing of PCIs: n = 882,579 NMD-visible PCIs and n = 500,488 NMD-invisible PCIs. Expression levels (RPKM) are represented in log scale