
Fig. 5.
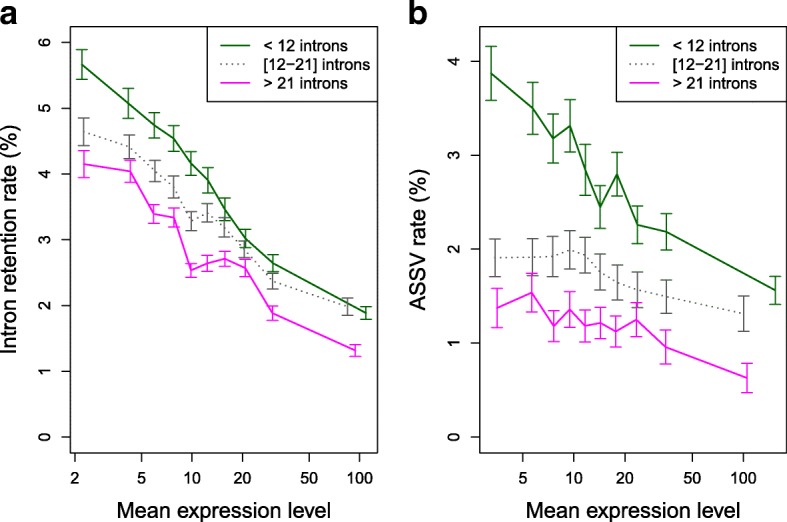
Relationship between AS rate, expression level, and number of introns in human genes. a IR rate (n = 118,703 introns). b ASSV rate (n = 102,697 introns). In both panels, introns were first classified into three groups of equal sample size, according to the number of introns of the genes in which they are located (genes with < 12 introns, genes with 12–21 introns, genes with > 21 introns), and then further grouped into ten bins of equal sample size, according to gene expression levels. We computed the average AS rate (IR or ASSV) over all introns within each bin. Error bars represent the 95% CI of the mean. Expression levels (RPKM, averaged over the 52 samples) are represented in log scale