Fig. 6.
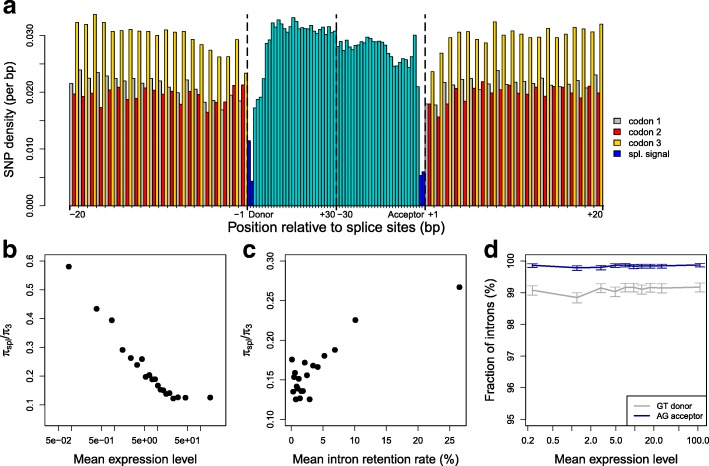
Variation in selective constraints on splice signals in human genes. a SNP density was measured in the vicinity of exon-intron boundaries (first and last 30 bp of introns and 20 bp of flanking exons), over all introns located between coding exons (n = 170,015). Splice sites (first and last 2 bp of introns) are displayed in dark blue, other intron positions in light blue. Within coding regions, the SNP density at each site was computed separately for the three codon positions (gray: position 1, red: position 2, yellow: position 3). b The level of selective constraints on splice signals increases with gene expression level. Introns were classified into bins of equal sample size, according to gene expression levels. Within each bin, the fitness impact of mutations on splice sites was estimated by measuring the ratio πspl/π3, where πspl is the SNP density at splice sites and π3 is the SNP density at flanking third codon positions. c The level of selective constraints on splice signals decreases with increasing IR rate. Introns were classified into bins of equal sample size according to their average retention rate and the ratio πspl/π3 was measured in each bin. d The fraction of introns with consensus splice signals does not vary with gene expression level. The proportion of introns matching the consensus splice donor (GT) and the proportion of introns matching the consensus splice acceptor (AG) was computed for each bin of expression level. Error bars represent the 95% CI of this proportion. b, d Mean expression levels (RPKM) are represented in log scale

