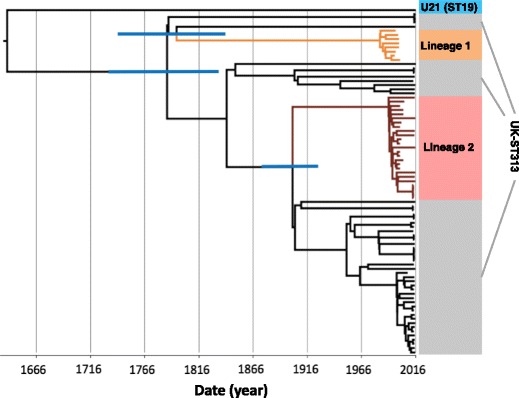
Fig. 3.

The timed phylogeny of all UK-isolated ST313 strains from this study and a representative sub-sample of ST313 genomes from Okoro et al. [7]. Figure shows the maximum clade credibility tree from BEAST. Branches 95% HPD are displayed in blue for key nodes defining lineage 1 and lineage 2 (for tree with all 95% HPD, see Additional file 3: Figure S4). Branches belonging to lineage 1 are coloured orange and branches belonging to lineage 2 are coloured brown
