
Fig. 3.
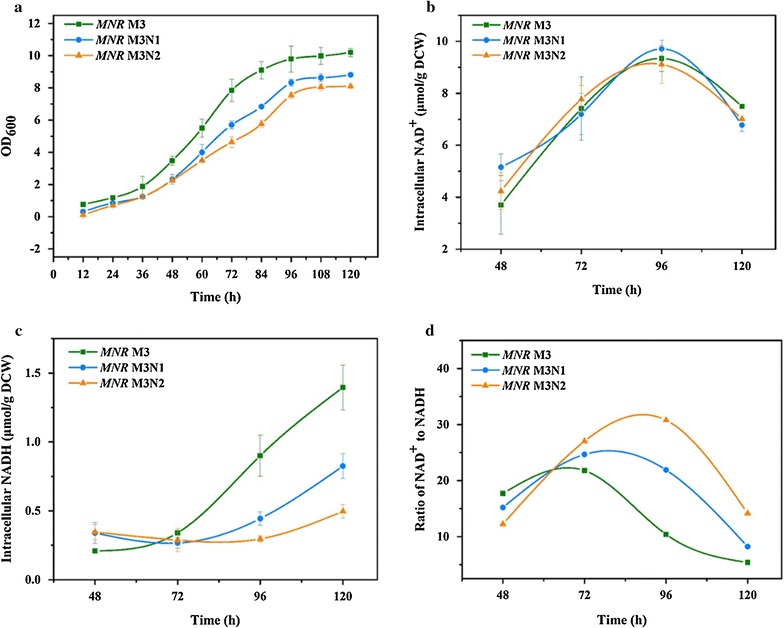
Time courses of various parameters during cultured in minimal medium with MNR M3, MNR M3N1, MNR M3N2, respectively. It shows the cell growth (a), the concentrations of intracellular NADH (b), NAD+ (c), and NAD+/NADH ratio (d). Biotransformation conditions: 50 mL fermentation medium in 250 mL shake flask, 30 °C, 140 r/min for 120 h culture. The error bars represent mean ± SD (n = 3)