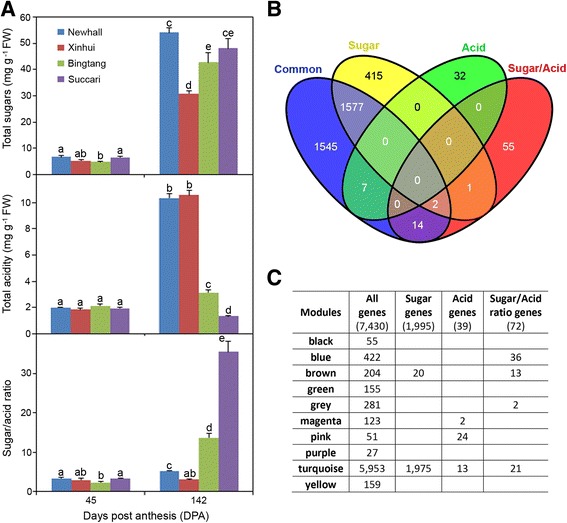
Fig. 1.

Comparison of sugar/acid ratios in four different sweet orange varieties and of genes and modules associated with sugar, acid and sugar/acid ratios. (a) Comparison of sugar and acid levels and sugar/acid ratios in different sweet orange varieties. Sugar and acid levels were adapted from a prior manuscript [14], and the sugar/acid ratios were calculated using the sugar and acid levels in each fruit for each variety. Values are means and SE of three fruits. Different letters above the column indicates a significant difference (p < 0.05). (b) Venn diagram of overlapping genes correlated with sugar and acid levels and sugar/acid ratios. “Common” refers to the genes commonly regulated from 45 to 142 DPA in all varieties. (c) Comparison of the number of genes associated with sugar, acid and sugar/acid ratio in each of the gene co-expression modules derived from WGCNA
